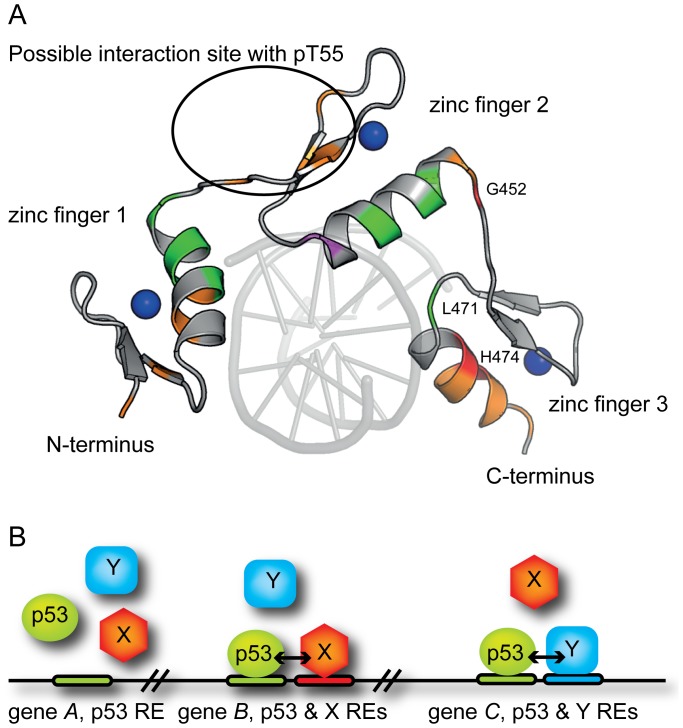
Figure 6. Interaction model for p53 and KLF4.
A: View of the KLF4 zinc-finger domain bound to DNA (residues 395–479, human KLF4 sequence), PDB 2WBU [36]. Side-chains of residues involved in the interaction are shown (green- moderate (0.035–0.055), orange – intermediate (0.55–0.1) and red – large (>0.1) weighted chemical shift perturbations). Residues with signals shifted only in the presence of the phosphorylated peptide, cluster on the second zinc finger and are encircled. Zn-atoms are shown as blue spheres. The binding site observed between residues 386 and 395 is not shown as this part was absent in the crystal structure. Please note that DNA was not present in our NMR experiments. B: Cooperative binding of transcription factors to DNA increases their specificity. TFs are represented by shapes, corresponding REs by horizontal bars of the same colour, and genomic DNA by a black line. Gene A: DNA-binding specificity of p53 alone is not sufficient to guide it to a specific site. Gene B: Cooperative binding with another TF “X” (e.g., KLF4) mediated by protein-protein interactions would recruit both TFs to a specific locus containing both REs (p53/“X”). Gene C: Direct or indirect interactions with another TF “Y” would recruit both TFs to a p53/“Y” specific locus.

