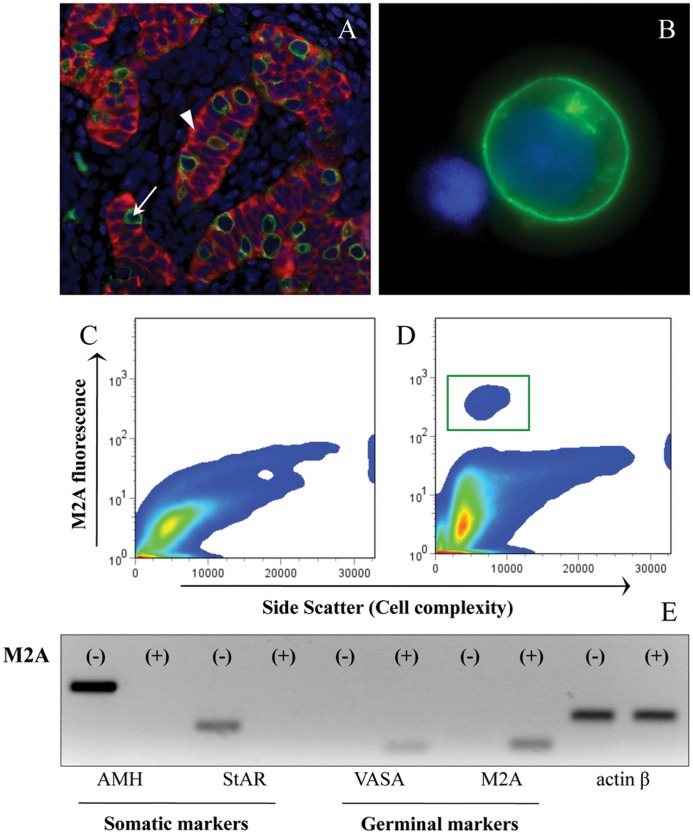
Figure 4. Isolation of M2A-positive and –negative cells from human fetal testes by flow cytometric cell sorting.
Histological immunofluorescent staining for M2A (green) and AMH (red) in human fetal testis (A). M2A staining in living dissociated testicular cells (B). DNA was stained with DAPI (blue color in (A) and (B)). Cell sorting profiles of M2A fluorescence in fetal testicular cells incubated with isotype control (C) or anti-M2A antibody (D). The green square (D) represents the cell fraction sorted as M2A-positive. mRNA expression of different cell type markers in M2A-positive and -negative cell fractions (E). AMH and StAR are markers of Sertoli and Leydig cells, respectively, while VASA and M2A characterize the germ cell population. Actin β was used as control. White arrow indicates M2A positive cell, white arrowhead indicates AMH positive cell.

