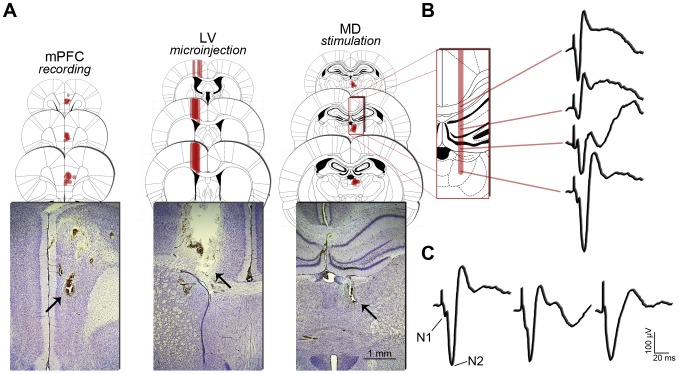
Figure 1. Histological validation of implants and typical prefrontal fPSPs.
(A) Positioning of electrodes and cannulae from a coronal point of view. For mPFC and MD, coronal plates represent the anteroposterior variation of the electrode tip positioning (red dots), preferentially at the PrL of mPFC (layer-inespecific) and the anterior half of MD (subdivision-inespecific), both in the left hemisphere. For LV, the coronal plates show the variation of the cannula positioning (red bars) just above the right lateral ventricle, where the experimental drugs were injected. In the representative Nissl-stained coronal sections, the arrows point to typical electrolytic lesions (applied after the end of the experiments) and cannula tract. (B) Once the recording electrode was positioned at the mPFC, a typical dorsoventral profile of fPSPs was consistently evoked across subjects, while the stimulation electrode was lowered towards the MD (see details in the text). (C) Diversity of MD-evoked fPSPs recorded in the mPFC. The first fPSP shows a clear differentiation between two distinct negative peaks, which we termed N1 (amplitude 108.20±9.32 µV; latency 6.85±0.15 ms) and N2 (amplitude 270.00±17.10 µV; latency 13.43±0.17 ms). Such an aspect of fPSP was obtained in approximately half the subjects. In some cases, like the second fPSP, the N1 peak was subtle. Finally, in some other cases, like the third fPSP, the N1 peak was indistinguishable.

