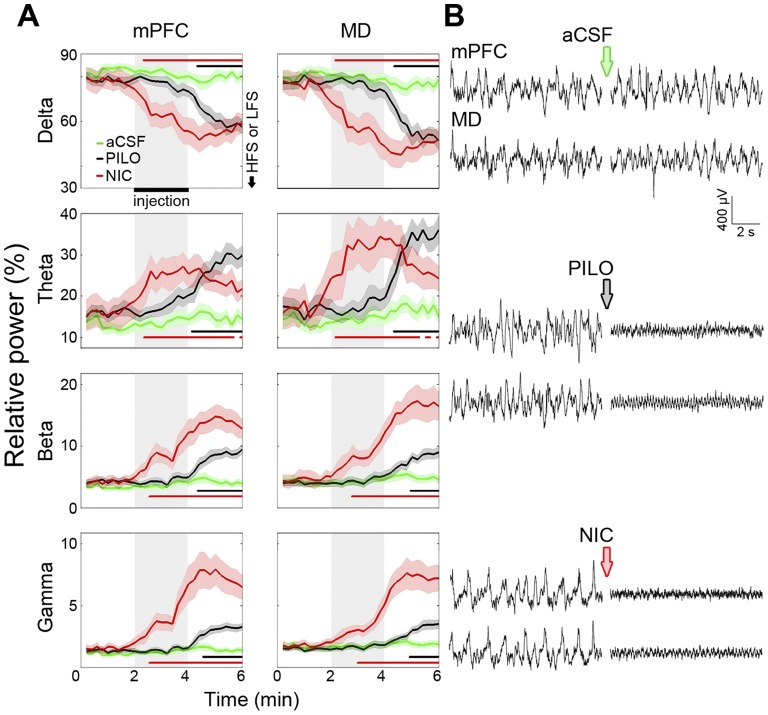
Figure 3. LFP power spectrum comparing mPFC and MD oscillatory activity before, during, and after microinjection.
(A) Charts detailing PILO and NIC effects on LFPs, showing a decrease in delta (0.5–4 Hz), as well as an increase in theta (4–12 Hz), beta (12–30 Hz), and gamma (30–80 Hz) relative power. The LFP changes induced by NIC occurred earlier than those induced by PILO, with a shorter duration of theta potentiation, and a stronger potentiation of beta and gamma waves. The data were obtained from all aCSF, PILO and NIC rats of the synaptic plasticity experiments. Significant differences are indicated by two-way repeated measures ANOVA followed by the Newman-Keuls post-hoc test (black bar: aCSF vs. PILO; red bar: aCSF vs. NIC). (B) Representative EEG tracings from mPFC and MD before and after icv microinjections. Data are shown as the mean ± SEM.

