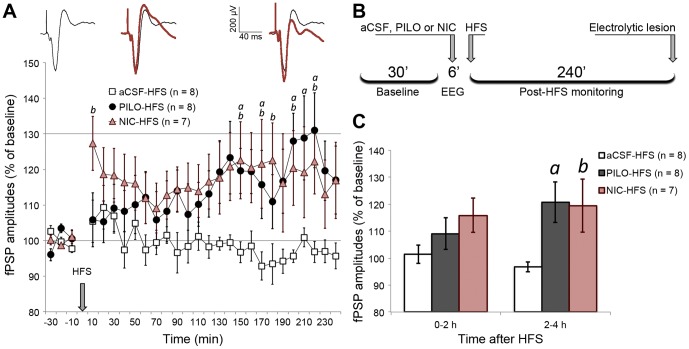
Figure 4. HFS induced a late LTP in mPFC only when applied under PILO and NIC effects.
(A) fPSP amplitude throughout baseline (30 min) and post-HFS monitoring (240 min), depicting amplitudes averaged in 10-min blocks and normalized in relation to baseline mean amplitude. Significant differences are indicated by two-way ANOVA with repeated measures, followed by the Newman-Keuls post-hoc test (a = PILO vs. aCSF; b = NIC vs. aCSF; p<0.05). The sequence of averaged fPSPs above the chart represents a typical PILO-HFS experiment, where post-HFS fPSPs (red) are superimposed on baseline fPSPs (black). Such fPSPs are roughly aligned with the time course of the chart. (B) Timeline summarizing the procedures for HFS experiments. (C) Data from chart A clustered in blocks of 2 h after HFS, highlighting PILO and NIC significant effects restricted to the second half of the monitoring. Data are shown as the mean ± SEM.

