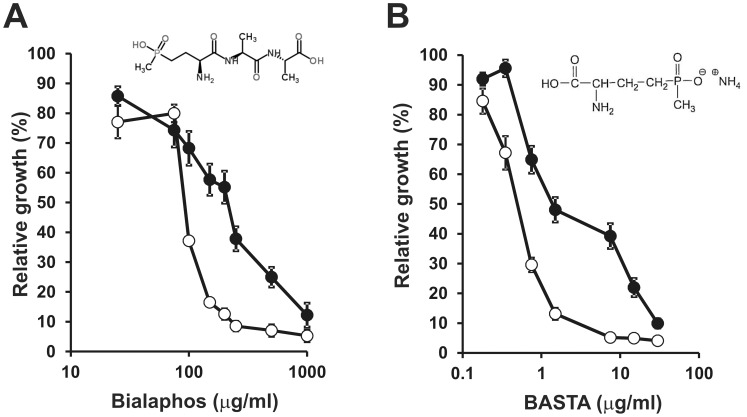
Figure 3. Bialaphos and sodium glufosinate sensitivity assay.
In both cases, bacterial growth was estimated by OD600 measurements after 72 h in the presence of different concentrations of the toxic tripeptide Bialaphos (A) or sodium glufosinate (B). (•), wild type strain 2011; (○), Δhfq mutant strain 20PS01. Data represent the growth measured for each S. meliloti strain in the presence of a given concentration of the toxic reagent relative to the growth in the absence of the chemical. Each bar shows average values for n = 3 replicate cultures ± SD. The experiment was repeated twice with similar results. The chemical structure of both chemicals is shown within each panel.

