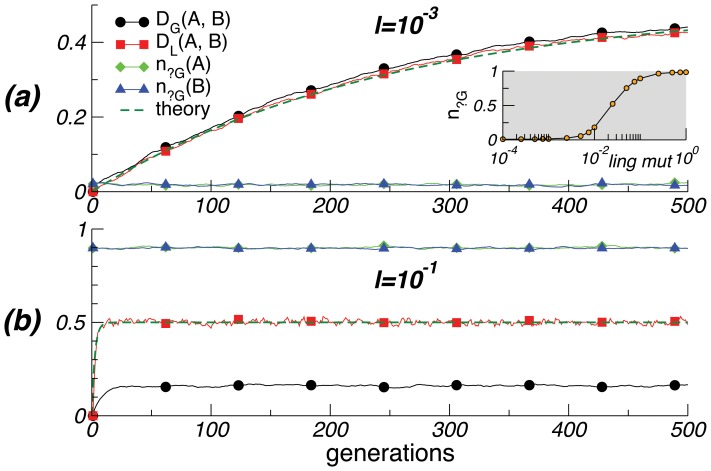
Figure 1. Population divergence.
DG(A, B) and DL(A, B) measure the genetic and linguistic divergence of the two subpopulations (created at generation 0), while nx measures the frequency of allele x. (a) When language change is slow, language provides a fixed target for the genes. As the two languages diverge, the genes for each subpopulation follow its ‘local’ language, and thus also diverge. Neutral alleles are eliminated, except for occasional re-emergence through mutation. The insert shows the stationary fraction of neutral alleles as a function of the rate of linguistic change. (b) With faster linguistic change, languages diverge immediately, but the populations are dominated by neutral alleles and hence remain genetically similar. The rate of linguistic change is derived through eq. 1. Parameters are: N = 100, m = 0.01, L = 20, f = 0.5; the initial fractions of alleles in the original population are n?g(t = 0) = 0.5, n+G(t = 0) = n-G(t = 0) = 0.25. Curves are averaged over 100 runs.

