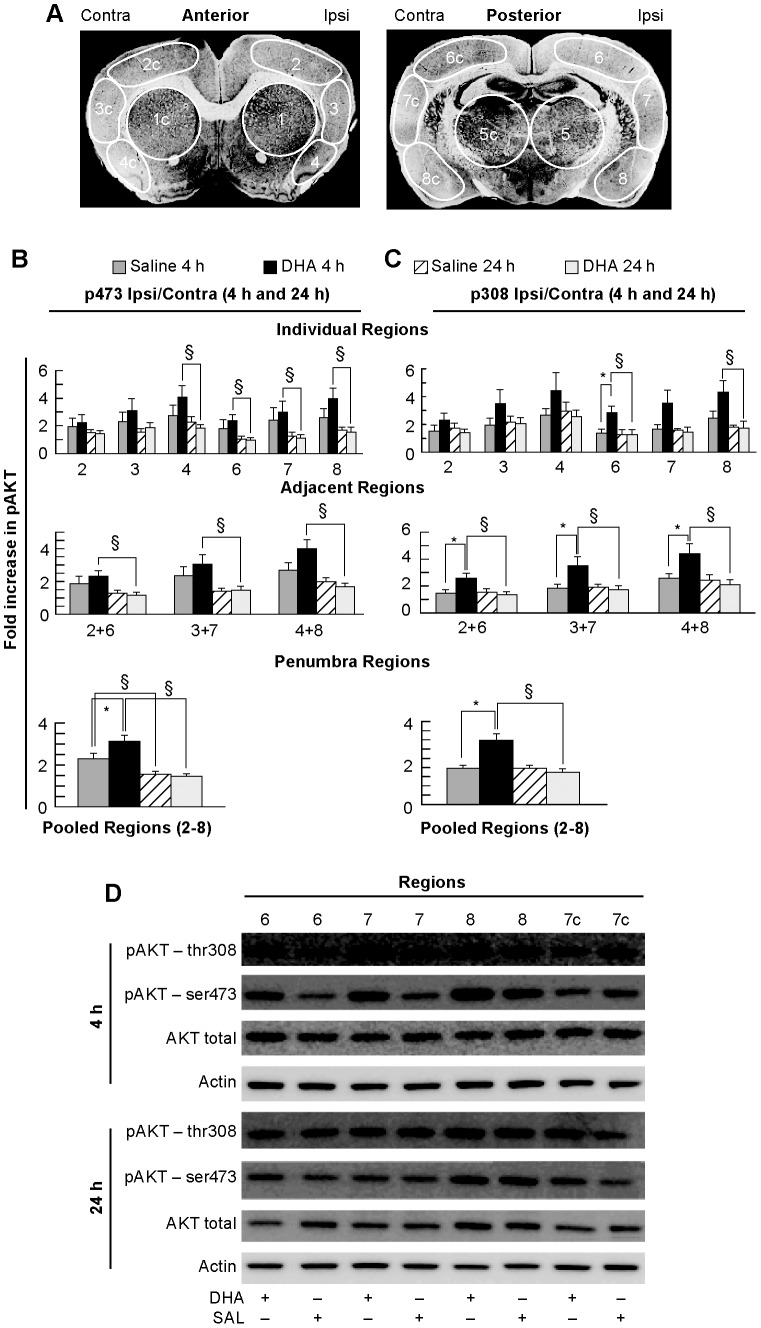
Figure 2. AKT phosphorylation in young animals.
Panel A: Schematic of coronal brain diagrams (bregma levels +1.2 and −1.8 mm) showing locations of regions for western blot analysis, conducted at 4 and 24 h after onset of stroke. Individual regions of the penumbra (2, 3, 4 and 6, 7, 8) were analyzed separately and also pooled together for Panels B and C. Panel D: Representative Western blots of AKT trials showing increased AKT phosphorylation in DHA treated animals at 4 h. DHA significantly increased AKT phosphorylation at 4 h. Data are mean ± SEM. * and § indicate significant differences between groups (p<0.05; repeated measures ANOVA followed by Bonferroni tests).

