
Figure 5. Behavioral, histopathology and lipidomic analysis in aged rats.
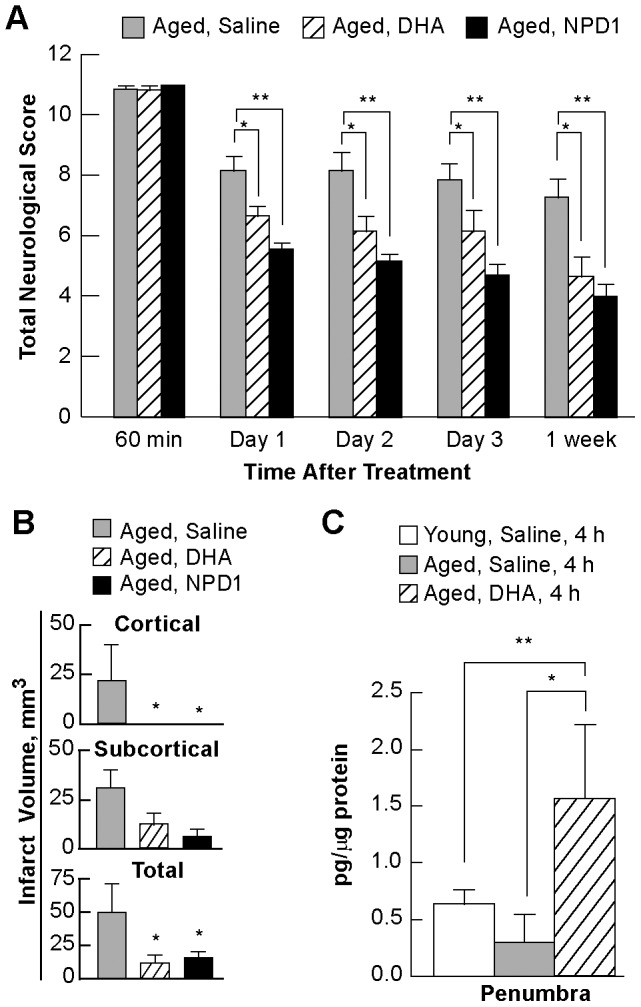
Panel A: Behavioral outcomes over 7 days. Panel B: Total, cortical and subcortical infarct volumes on day 7 after stroke. Panel C: NPD1 content was analyzed by lipidomic analysis at 4 h in young and aged rats treated with either saline or DHA. Data are mean ± SEM. * and ** indicate significant difference between groups (p<0.05; repeated measures ANOVA followed by Bonferroni tests).