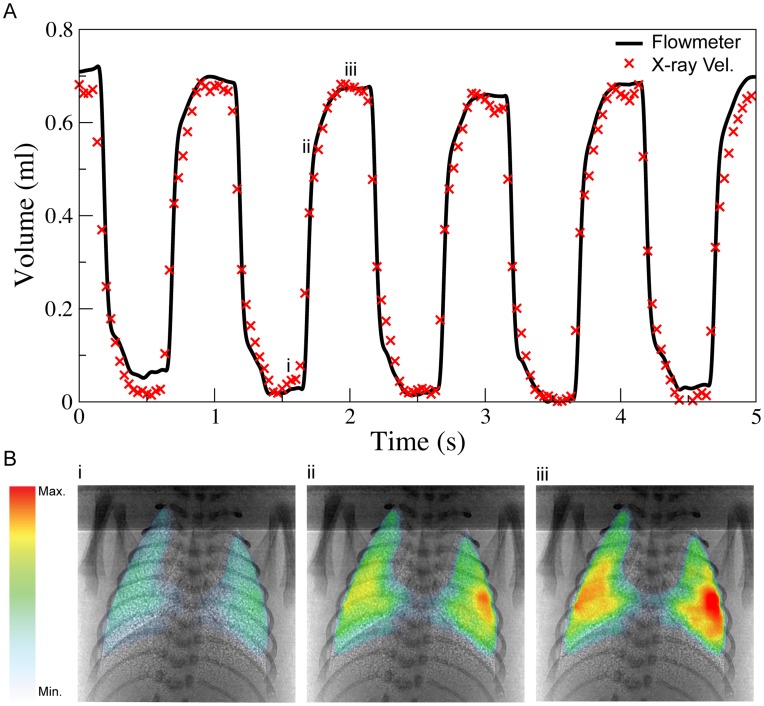
Figure 3. Temporal measurement of lung activity via traditional methods and the X-ray velocimetry technique.
A) Time plots showing the tidal volume delivered as measured with a flowmeter and X-ray velocimetry integrated expansion. The X-ray velocimetry integrated expansion was calibrated to volume according to the method of Fouras et. al [52]. The coefficient of determination between the flowmeter and the X-ray velocimetry volume was >0.96. The animal was being ventilated at PEEP of 9 cmH2O, PIP of 21 cmH2O and a frequency of 1 Hz. B) X-ray velocimetry integrated expansion maps calculated from the end expiration to early inspiration (i), mid-inspiration (ii) and end-inspiration (iii). The X-ray velocimetry integrated expansion maps correlate to the time indicated by the (x) symbols on the X-ray velocimetry time plot in A). It can clearly be seen that as inspiration progresses a greater amount of lung tissue expansion has occurred and the expansion maps are able to show where the changes have occurred with high spatial resolution.

