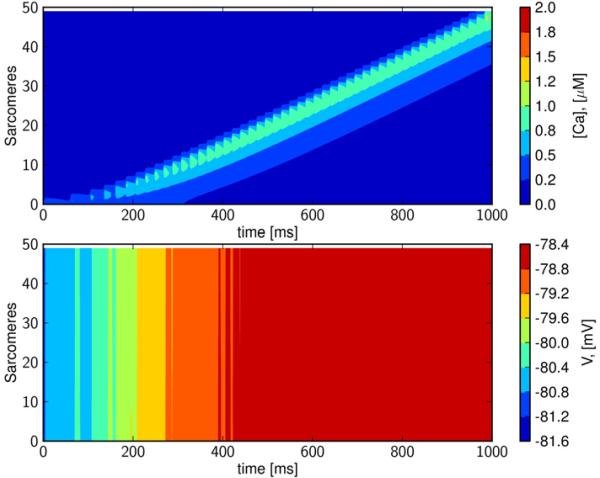
Figure 2. Intracellular calcium waves remain sub-threshold in healthy tissue.
Upper panel: A calcium wave in a single cell initiated by opening the RyR at one end of the cell. Lower panel: The corresponding transmembrane potential, which is seen to be almost constant; the relative changes are in the range of about 2%. Time is in ms, space is the node number; xj = jΔx, j = 1, . . . , 50, where Δx=2 μm is the length of a sarcomere, concentration of [Ca]i (upper panel) is in μM, and transmembrane potential (lower panel) is in mV. The speed of the calcium wave is about 100 μm/s.

