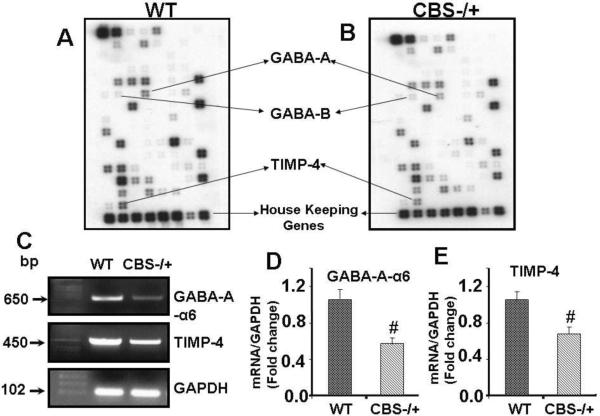
Figure 1. Gene array and RT-PCR analyses of GABA receptors and TIMP-4 in WT and CBS−/+ mouse brain.
A&B: The RNA was isolated, and equal amounts of poly(A)+ RNA from WT and CBS−/+ mouse brain was hybridized to cDNA array membranes. Affected genes are pointed with arrows. C: RT-PCR analysis of GABA receptors and TIMP-4 mRNA expression in WT and CBS−/+ mouse brain. The GAPDH housekeeping gene was used as the loading control. D&E: Densitometric analysis of GABA receptors and TIMP-4 mRNA expressions as represented in the bar diagram. #P<0.05 vs WT, n=4 animals/ group.

