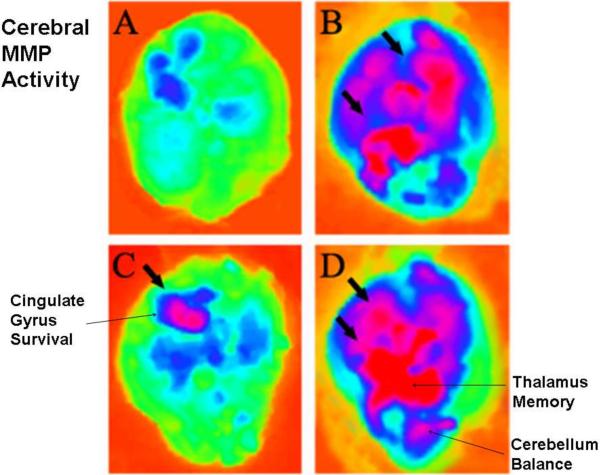
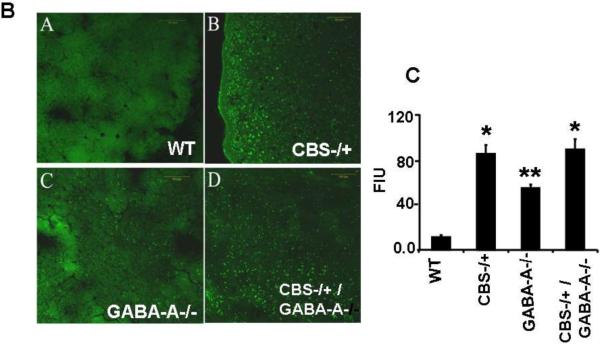
Figure 2. In situ Zymography in WT, CBS, GABA-A and double KO mice.
A: DQ- gelatin (a MMP substrate) was injected in tail vein 24- hours prior to in vivo imaging of the brain. In addition, FITC-labeled gelatin was infused through carotid artery prior to sacrifice the animal. The in fluorescence image of isolated brain was obtained in (A) WT; (B) CBS−/+; (C) GABA-A−/−; (D) CBS−/+ / GABA-A−/−. The arrows indicate MMP activity. B: in situ MMP activity in the brain. Cross-sections were prepared and MMP activiy was measured in tissue sections under confocal microscopein WT; CBS−/+; GABA-A−/−; CBS−/+ / GABA-A−/−. The arrows indicate capillaries and MMP activity. C: Densitometric analysis of MMP activity. *P<0.05 vs WT, **P<0.05 vs CBS−/+ ; n=4 animals/group.


