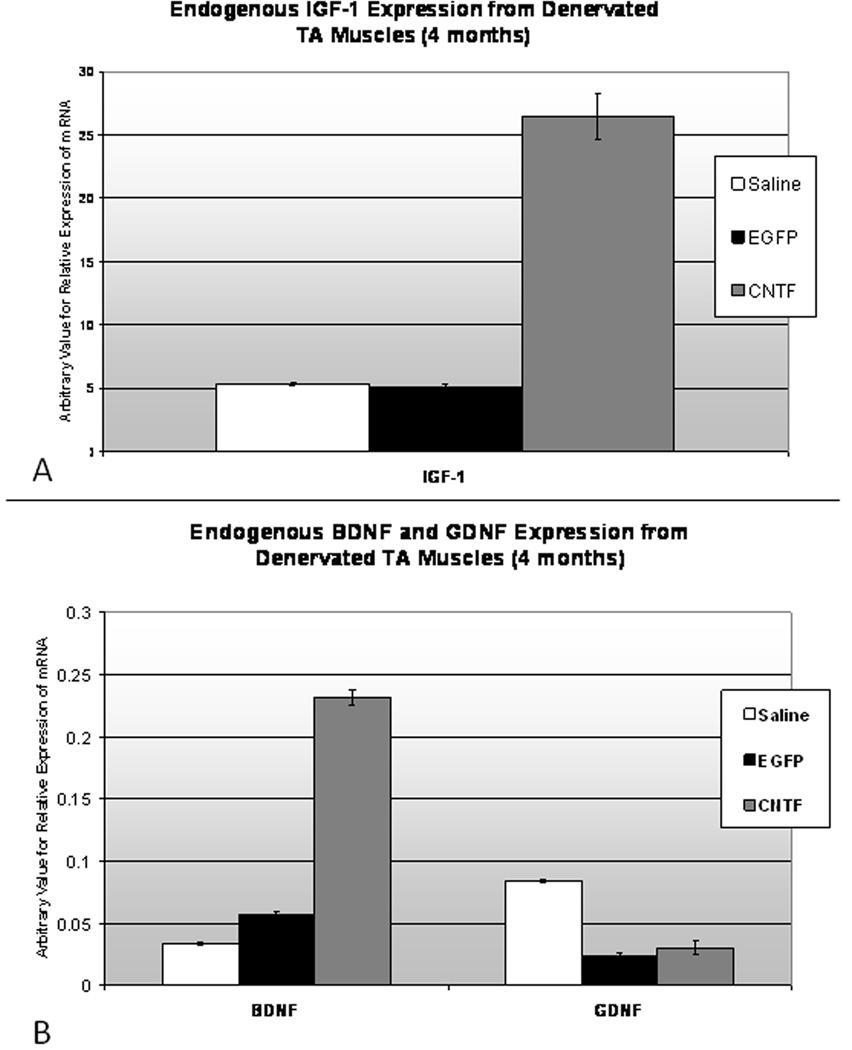
Figure 13. Endogenous NF Expression from Denervated TA Specimens.
Figure 13A. Because there was a several fold difference in IGF-1 expression compared to BDNF and GDNF, IGF-1 is represented in the above (14A) figure with its unique y axis. At 4 months, RT-PCR demonstrates increased IGF-1 expression (above) from the denervated TA in the animals who had received CNTF-MSC injections (* indicates p<0.05). In comparison, the animals treated with MSCs alone (middle) and those animals injected with saline (left) demonstrated similar levels of IGF-1. The arbitrary values of mRNA expression for all NFs were determined based on GAPDH as a standard internal control. Figure 13B. At 4 months, RT-PCR also demonstrated increased BDNF expression from the denervated TA in the animals who had received CNTF-MSC injections, while the GDNF expression showed no difference between groups (* indicates p<0.05). For the denervated TA muscles treated with MSCs alone (EGFP) and saline, no significant differences were noted between BDNF and GDNF expression levels.

