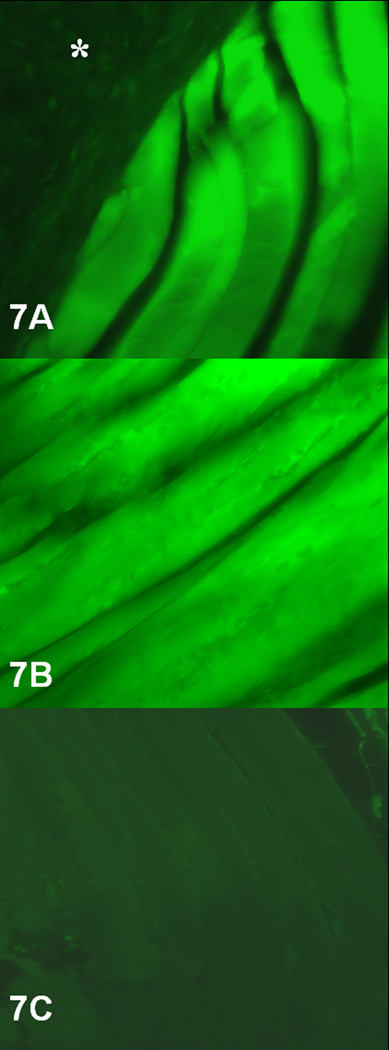
Figure 7. TA myofibers in the CNTF-MSC injected group at 2 months and 4 months.
Fluorescent microscopy at 20X demonstrates that representative sections of CNTF-MSC injection TA at 2 months (7A) and 4 months (7B) have similar levels of green fluorescent intensity, confirming survival of the CNTF-MSCs. The asterisk (*) overlies the laryngeal cartilage (dark), showing the EGFP tracking marker is specific to the myofibers. The bottom microphotograph (7C) demonstrates a representative control (saline) injected TA with no fluorescence identified within the myofibers.

