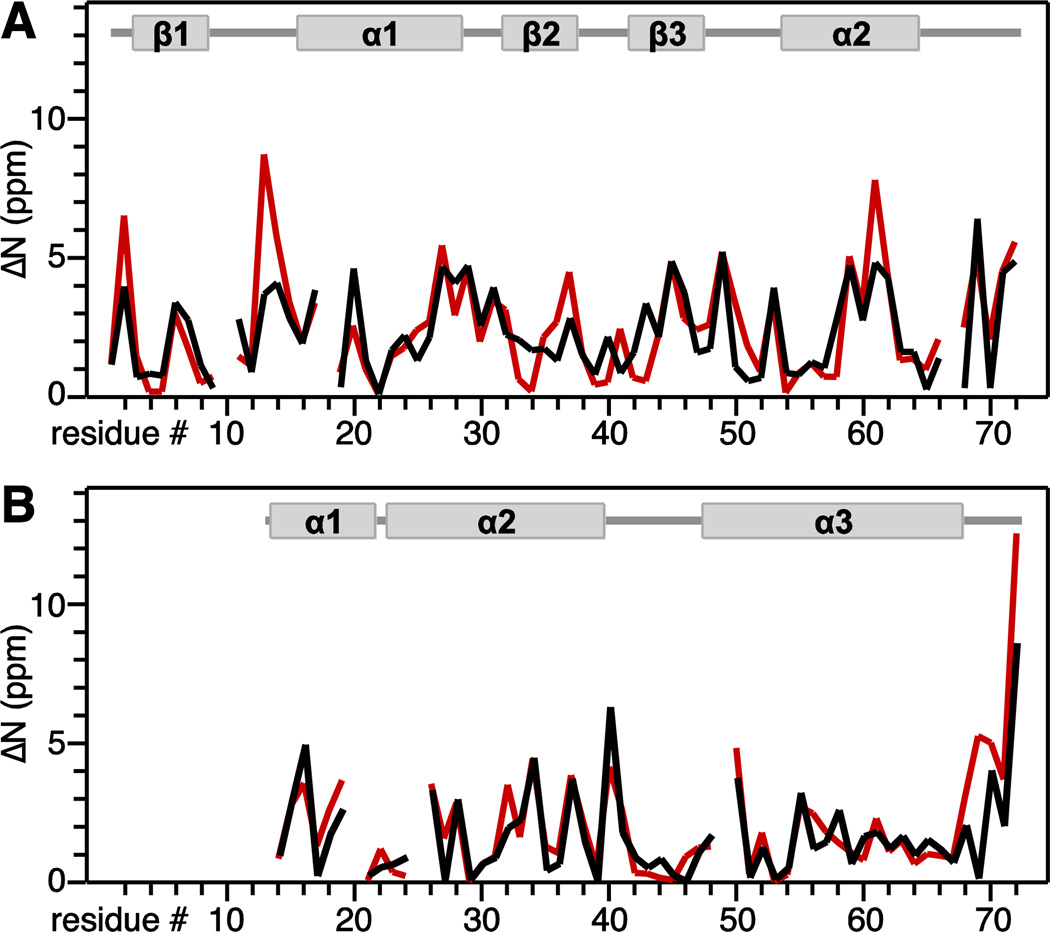
Fig. 4. Residue-specific improvement in 15N chemical shift prediction accuracy obtained by ensemble averaging for MerP (A) and MerFt (B).
The improvement value ( N) is the difference between experimentally observed chemical shifts and chemical shifts predicted from single lowest energy Rosetta structure (red), or chemical shifts predicted and averaged over 20 lowest energy Rosetta structures (black). Protein secondary structures are shown above the graphs.

