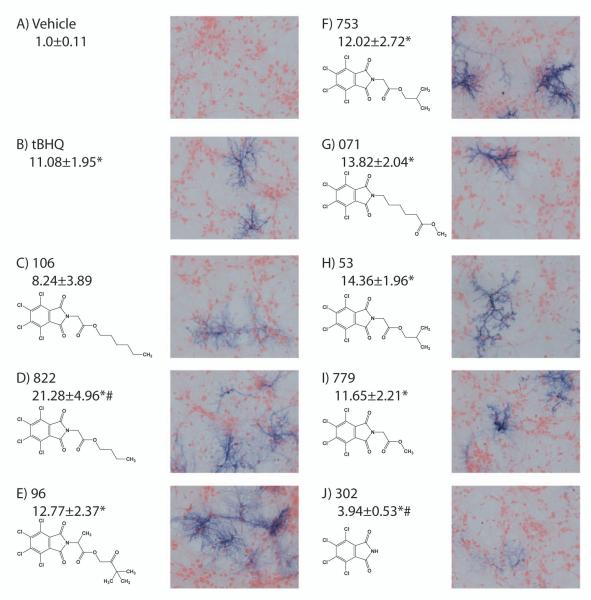
Figure 3.
hPAP histochemistry and fold activation in mixed cultures treated with 25μM doses of compounds. A) vehicle-treated cells, B) tBHQ-treated cells C-J) Structures of novel compounds, representative hPAP histochemistry and average fold hPAP activation. Compounds arranged according to LogP. Average fold change (mean ± SEM; n=4-10) shown underneath compound name. *Significantly different the than corresponding vehicle-treated value (p<0.05). #Significantly different than the corresponding tBHQ-treated value (p<0.05).

