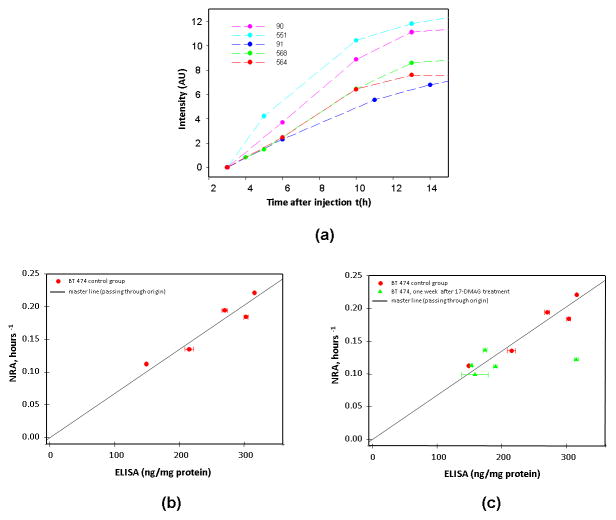
Figure 2.
a. Intensity values (tumor-contralateral) from control group (n = 5 mice/group)
b. Correlation between the Normalized Rate of Accumulation (NRA) of the fluorescent biomarker (Affibody-Alexa Fluor 750), from control group of mice with tumor BT474 and ELISA measurements obtained from the same tumor.
c. Correlation between the NRA and ELISA measurements from treatment group (n=5 mice/group) at 7days after the course of treatment, comparing to the control group. In both measurements HER2 overexpression and range of its variations are smaller as compare to control group.

