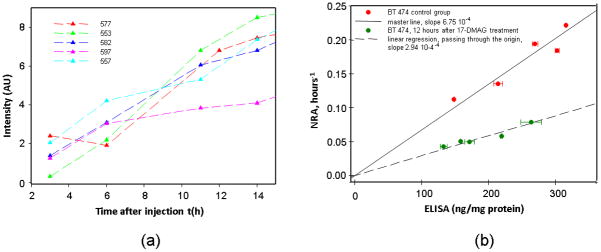
Figure 5.
a. Intensity values (tumor-contralateral) from treatment group (12 h after the course of treatment) (n = 5 mice/group)
b. Correlation between the NRA and ELISA measurements obtained from treatment group (n = 5 mice/group) at 12 h after the course of treatment. (modified procedure; no additional blood circulation in the tumor area is assumed). For the 17-DMAG-treated mice 12 h after treatment, the slope of NRA-ELISA dependence (modified master line) is ~2.2 times smaller.

