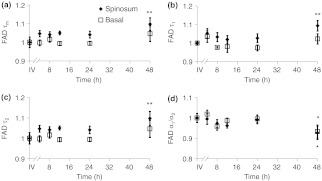
Fig. 5.
Changes ( of measurements) relative to in vivo (IV) values of FAD (a), (b), (c), and (d) observed from both the spinosum (diamond) and basal (square) epithelial layers of tissues maintained in live culture for 48 h. is mean lifetime (). Asterisk denotes significant difference between in vivo and indicated measurement (, ).

