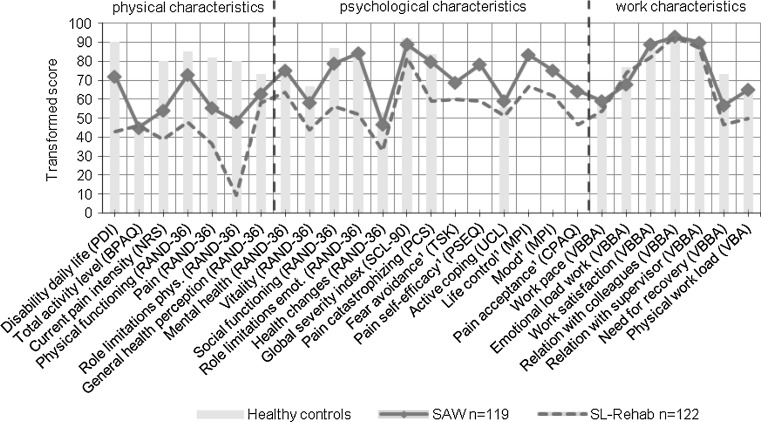
Fig. 1.
A comparison of the SAW group, SL-Rehab group, and healthy working controls. The y-axis represents transformed scores on a standardized 0–100 scale, in which higher scores represent more favorable situations. The x-axis shows all variables. No norm scores of healthy controls were retrieved for variables indicated with ¹

