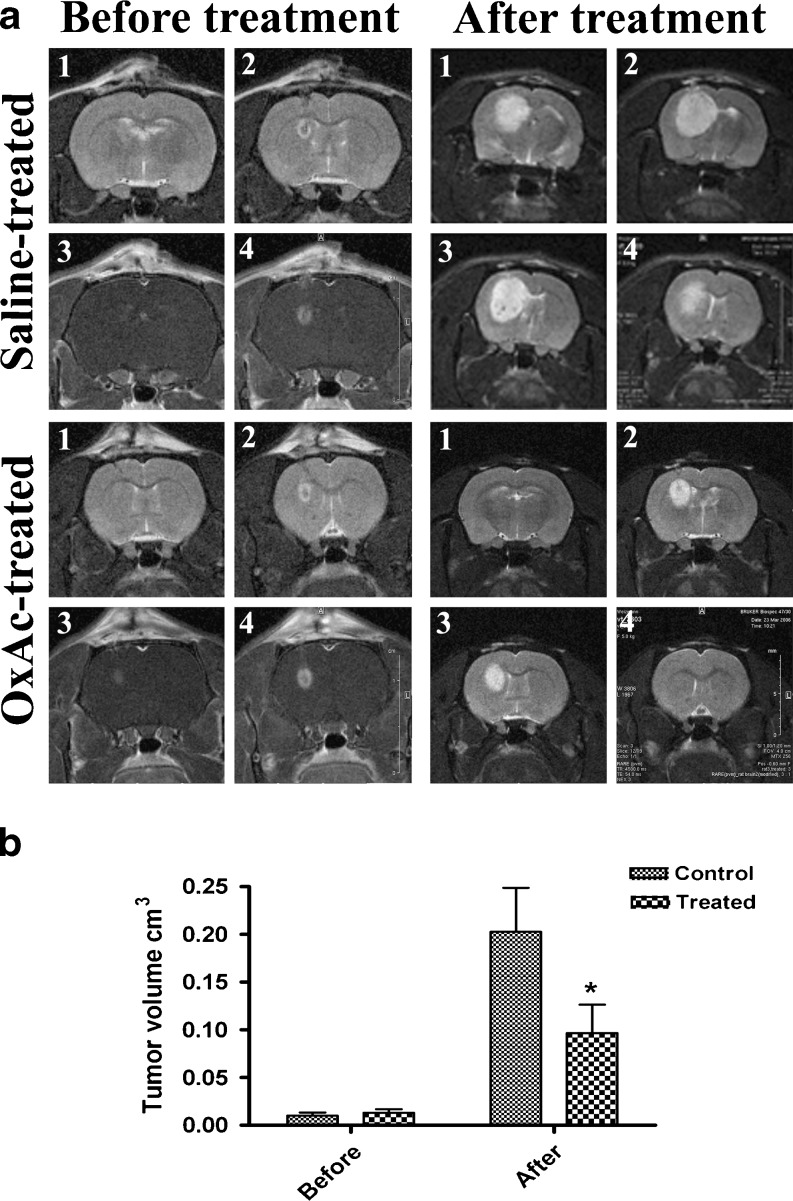
Fig. 1.
a. A representative example of MRI analysis of C6 glioma growth in vivo. At 7 days post-implantation and before the treatment, an MRI imaging was performed (left column, 1–2 pictures T2 imaging, 3–4 pictures T1 imaging). The rats were randomized and either treated with 0.2 M OxAc or 0.3 M NaCl for additional 14 days. The MRI imaging was performed again at the end of the treatment (21 days post glioma implantation, right column, 1–4 pictures T2 imaging). b. Tumor volume of the rats before and after the treatment was calculated in n = 14 for control group and in n = 15 for the treated group using MRIcro software. OxAc-treated rats show significantly reduced tumor growth compared to the control group. *p < 0.01 (repeated measures ANOVA test)

