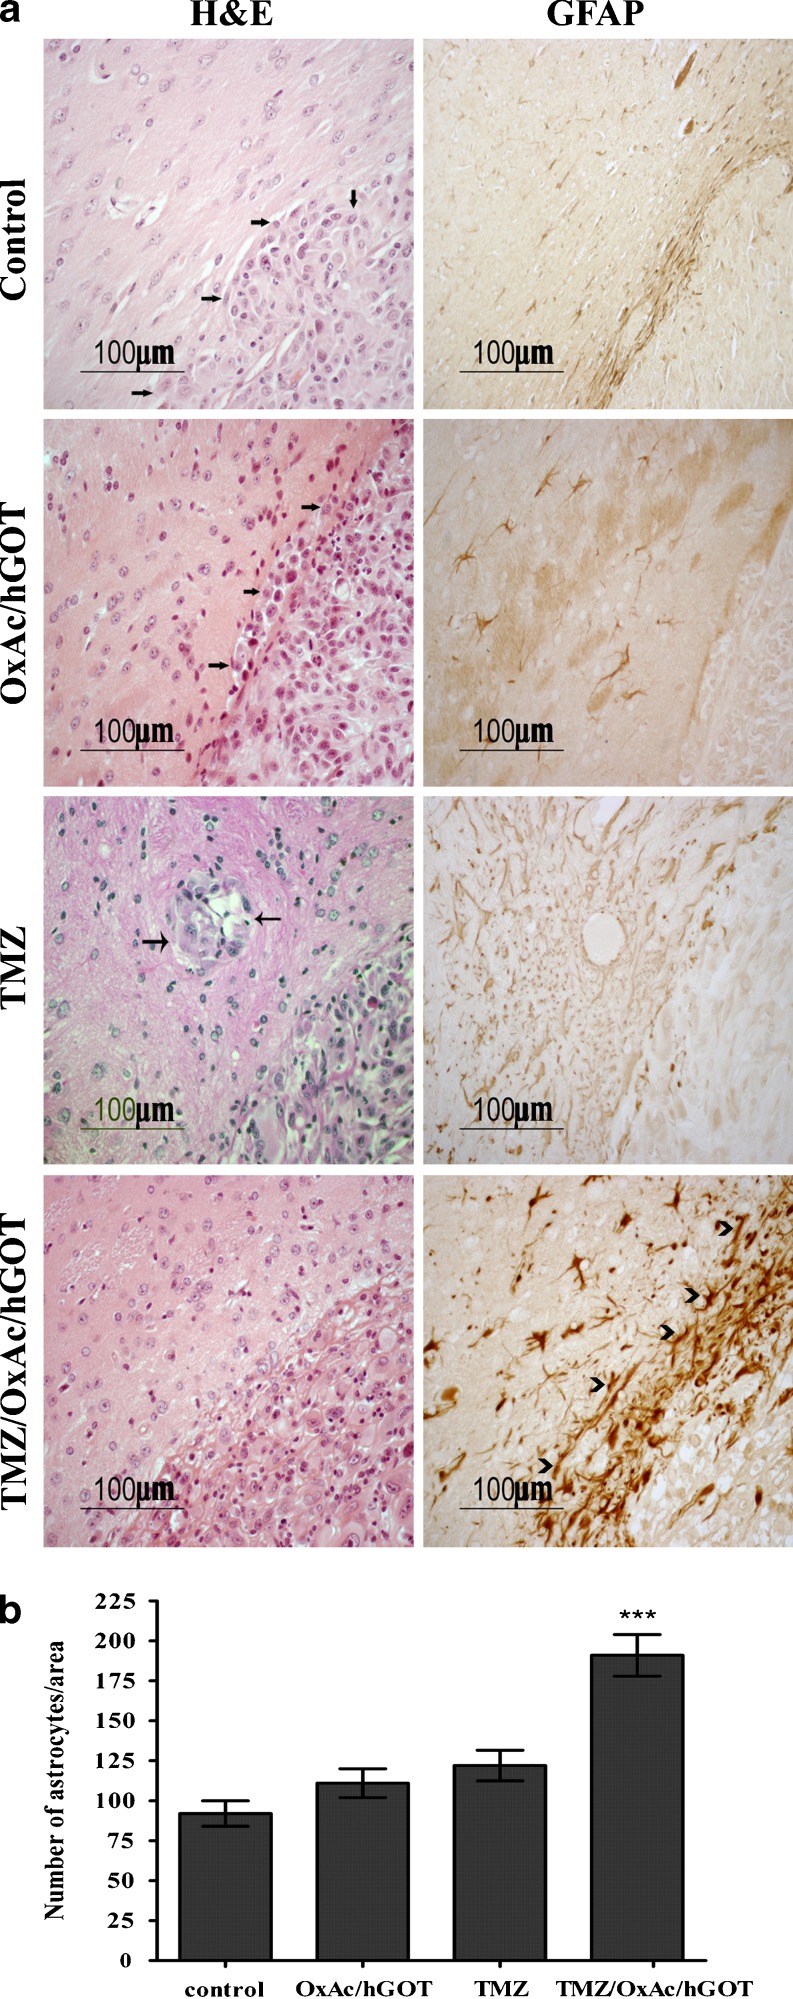
Fig. 4.
Morphological evidence of the tumor invasiveness derived from U87 glioma cell line. a. Representative example of immunohistochemistry staining for H&E and GFAP. Staining by H&E showing infiltration of the brain parenchyma by tumor cells detached from the main tumor mass, arrows indicate the infiltrative cells (left column). Staining for GFAP showing the astrocytes cells around the tumor borders, arrowheads indicate the GFAP positive astrocytes (right column) b. Quantification of the number of astrocytes as indicated by positive GFAP staining,; ***p < 0.001 vs. all other groups, One-way ANOVA+ Newman-Keuls test, n = 4

