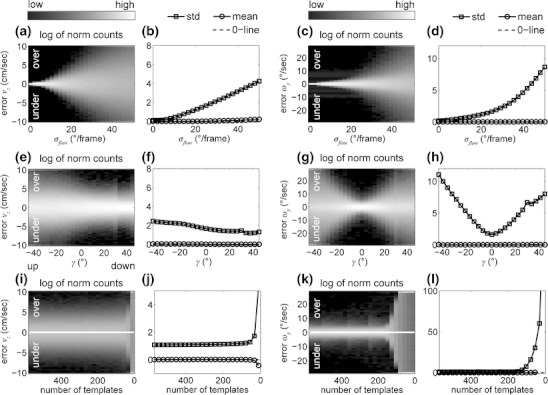
Fig. 4.

Errors for self-motion estimation while varying noise, tilt, or the number of flow templates. (a-d) shows the errors for varying Gaussian noise, (e-h) tilt angles, and (i-l) number of templates with σ flow = 25 °/frame in the latter two cases. Normalized histograms (a, c, e, g, i, k) are individually computed for every parameter value. Normalized counts for each bin are log-enhanced and displayed in gray-values ranging from black to white encoding low and high counts. The standard deviation and mean value of errors are displayed in the curve plots (b, d, f, h, j, l). Note that the intervals for plots (j) and (l) are different from those in previous rows. Legends are printed atop of each column. The error statistics includes three trajectories
