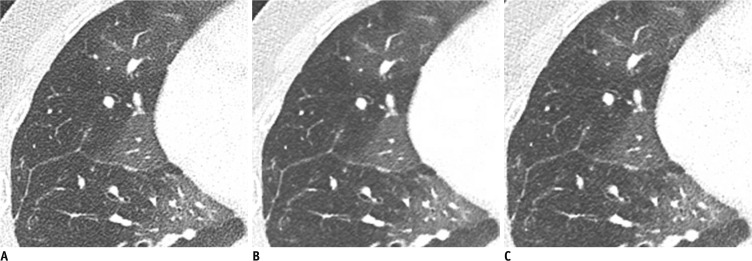
Fig. 2.
Standard dose contrast enhanced-chest CT in 19-year-old man (BMI, 21 kg/m2) with pulmonary hypertension.
A-C. Transverse CT images at 1 mm thickness with full radiation dose reconstructed with (A) FBP and (B) IRIS, and (C) with half radiation dose reconstructed with IRIS. When two readers compared F-FBP (A) and F-IRIS (B) images, reconstruction effect, they both had preference scores of 4 and 4 for lung 5 mm images, 3 and 3 for mediastinum, 4 and 3 for lung 1 mm images and 3 and 4 for overall (not shown). When two readers compared F-FBP (A) and H-IRIS (C) images, as reconstruction effect and radiation dose effect, readers' preference scores were 4 and each for lung 5 mm images, 3 and 2 each for mediastinum, 4 and 3 for lung 1 mm images and 4 and 3 for overall (not shown). BMI = body mass index, F-FBP = full dose image with filtered back projection, F-IRIS = full dose image with iterative reconstruction in image space, H-IRIS = half dose image with iterative reconstruction in image space

