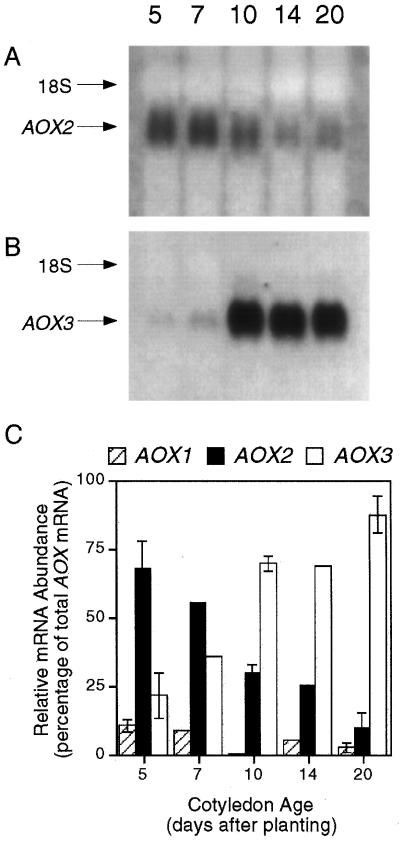
Figure 2.
Northern analysis of changes in the level of expression of AOX2 (A) and AOX3 transcripts (B) during the development of soybean cotyledons. Each lane contained 2 μg of poly(A+)-enriched RNA. Numbers across the top refer to seedling age in days postimbibition. The position of 18S rRNA on each blot is indicated. Results from one of two independent experiments are shown. C, Relative abundance of AOX mRNAs as determined using a competitive reverse transcriptase-PCR assay. The results from one experiment are shown. For d 5, 10, and 20, n = 3, and for d 7 and 14, n = 1. Bars indicate se.

