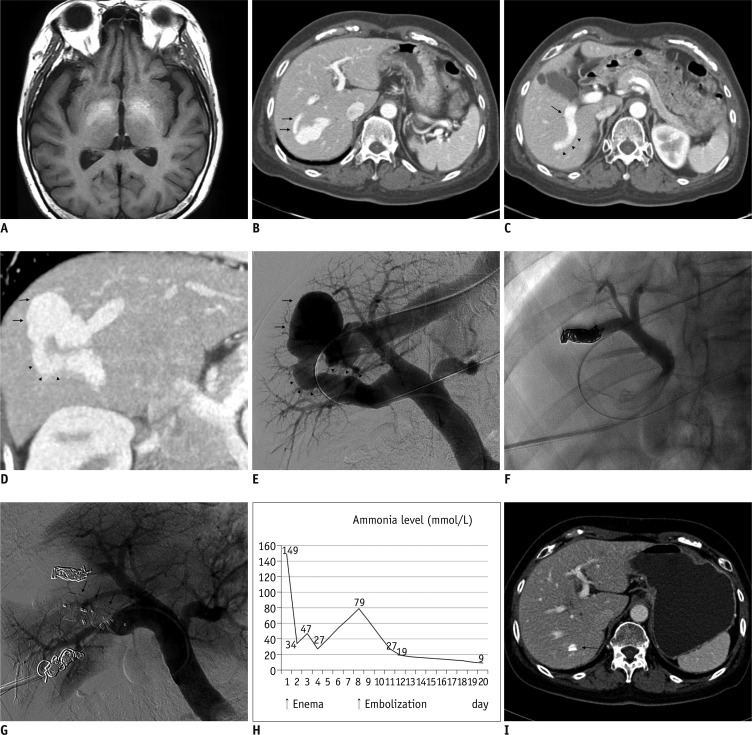
Fig. 1.
67-year-old woman with intrahepatic portosystemic venous shunt (IPSVS).
A. T1-weighted magnetic resonance imaging (MRI) scan showing high signal intensity in globus pallidus of basal ganglia. B. Axial contrast-enhanced computed tomography (CT) scan showing small shunt tract (arrows) communicating directly from right anterior portal branch to aneurysmal sac of IPSVS and hepatic vein. C. Axial CT scan showing large shunt tract (arrowheads) communicating from central portion of right posterior portal vein (arrow). D. Oblique reformatted CT scan showing aneurysmal sac (arrows) of IPSVS and large shunt tract (arrowheads) communicating from right posterior portal vein. E. Pre-embolization direct portogram showing aneurysmal sac of IPSVS (arrows) and large diameter of shunt tract (arrowheads). F. Spot image showing embolization of small shunt tract using coils via 5-Fr catheter. G. Post-embolization portogram showing no abnormal blood flow through shunt or AMPLATZER™ Vascular Plug II (AVP II) devices (arrows). H. Graph showing changes in serum ammonia level. Three days after procedure, serum ammonia level decreased to within normal range. I. Axial CT scan three months after procedure showing margin of AVP II (arrow) and obliteration of IPSVS and aneurysmal sac.

