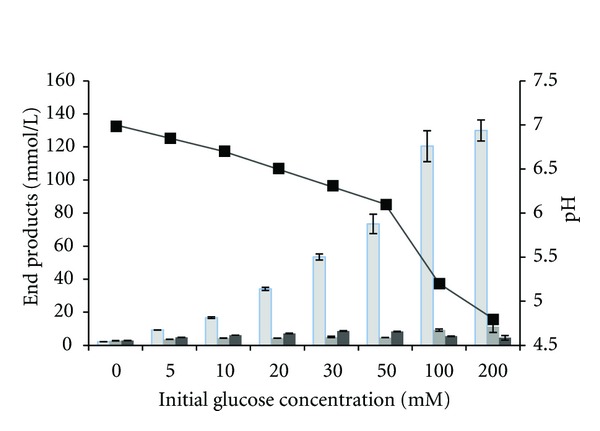
Figure 3.

End product formation from different initial glucose concentrations. Also shown are percent of glucose degraded. Values represent means of two replicates and standard deviation are shown as error bars. Columns from left to right; ethanol, acetate, hydrogen. pH measered after fermentation (▪).
