Figure 4.

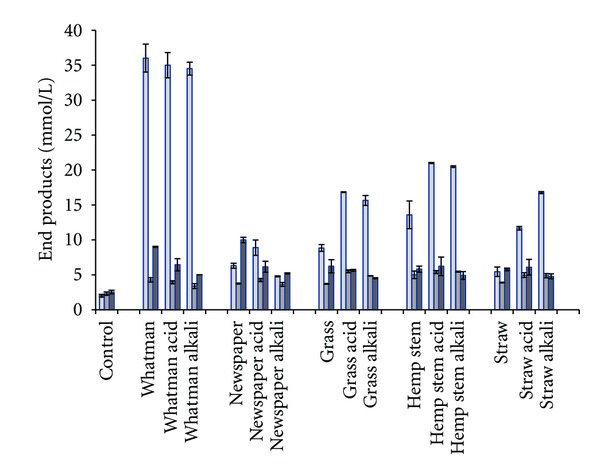
Production of end products from hydrolysates (4.5 g·L−1) from different biomasses. Values represent mean of two replicates (±standard deviation). From left to right: ethanol, acetate, and hydrogen.

Production of end products from hydrolysates (4.5 g·L−1) from different biomasses. Values represent mean of two replicates (±standard deviation). From left to right: ethanol, acetate, and hydrogen.