Figure 1.

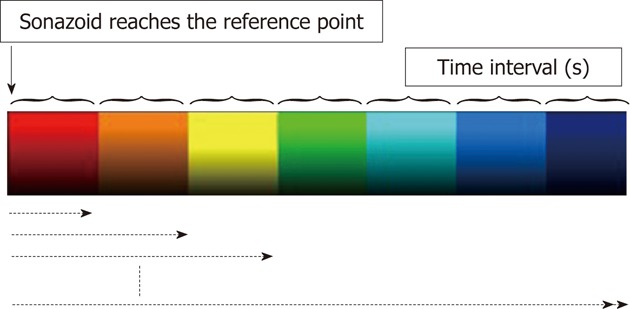
Delays in the arrival of the contrast agent at the target site compared with that at the reference point (0 s) are represented by red, orange, yellow, green, light blue, blue and dark blue at 0.5 s intervals.

Delays in the arrival of the contrast agent at the target site compared with that at the reference point (0 s) are represented by red, orange, yellow, green, light blue, blue and dark blue at 0.5 s intervals.