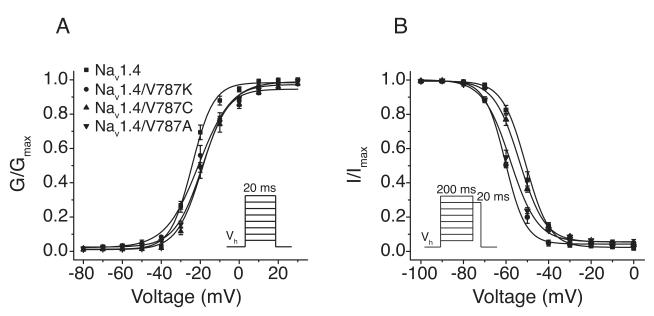
Figure 2. Voltage-dependent activation and steady-state fast inactivation of Nav1.4 and V787-mutated sodium channels.
(A) Conductance-voltage plots for sodium channel activation; peak sodium currents measured on depolarization from −120 mV to test potentials ranging from − 80 mV to 30 mV were transformed to conductances (G) using the equation G = I/(Vt-Vrev), where I is the peak current, Vt is the voltage of the test potential, and Vrev is the reversal potential; conductances were normalized to the maximal conductance (Gmax) for that oocyte; values are means ± S.E. of 15 (Nav1.4), 9 (Nav1.4/V787A), 7 (Nav1.4/V787C), or 11 (Nav1.4/V787K) separate experiments with different oocytes. (B) Voltage dependence of steady-state fast inactivation; conditioning pulses (200 ms) from −120 mV to potentials ranging from −100 mV to 0 mV (Vp) were followed immediately by 20-ms test pulses to either −10 mV (Nav1.4, Nav1.4/V787C, Nav1.4/V787K) or 0 mV (Nav1.4/V787A); peak currents were normalized to the maximal current measured during the inactivation protocol for that oocyte; values are means ± S.E. of 11 (Nav1.4), 9 (Nav1.4/V787A), 5 (Nav1.4/V787C), or 4 (Nav1.4/V787K) separate experiments with different oocytes; curves were fitted to the mean values using the Boltzmann equation.

