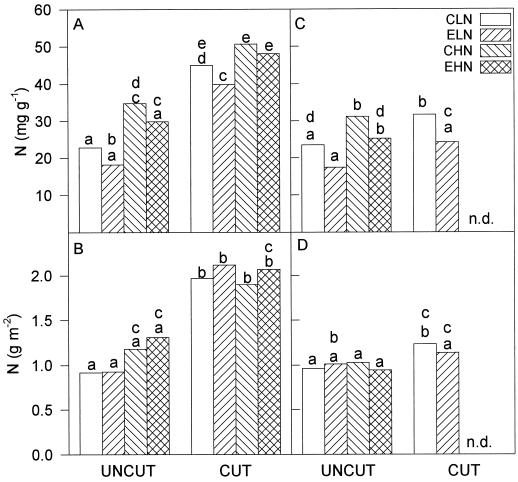
Figure 4.
Leaf N content of the plants described in the legend for Figure 2 for 1994 (A and B) and 1995 (C and D) expressed on a dry-mass basis (A and C) and a leaf-area basis (B and D). Treatments and their abbreviations are as in the legend for Figure 1. Letters above bars are as described in the legend for Figure 2. n.d., No data.

