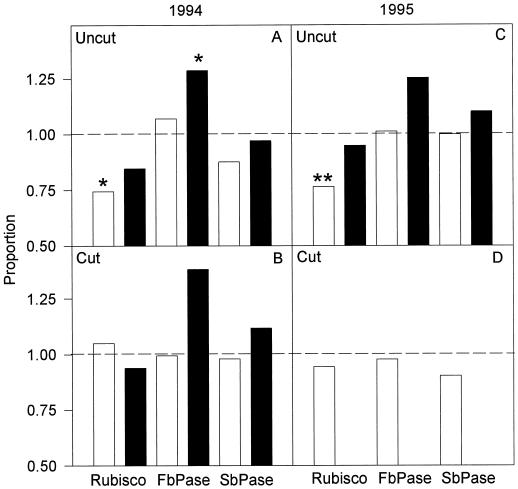
Figure 6.
Levels of LSU, FBPase, and SBPase as a proportion of the quantity at current pCO2 controls (n = 3). The value for each replicate was the average of three to five repeated western blots. The broken line indicates no difference between elevated/current pCO2. 1994 (A and B) and 1995 (C and D) at low N (□) and high N (▪). There was no defoliation experiment at high N in the 1995 season. *, Statistically significant at the 0.05 level (t, P < 0.05); **, statistically significant at the 0.01 level (t, P < 0.01) two-tailed t test.

