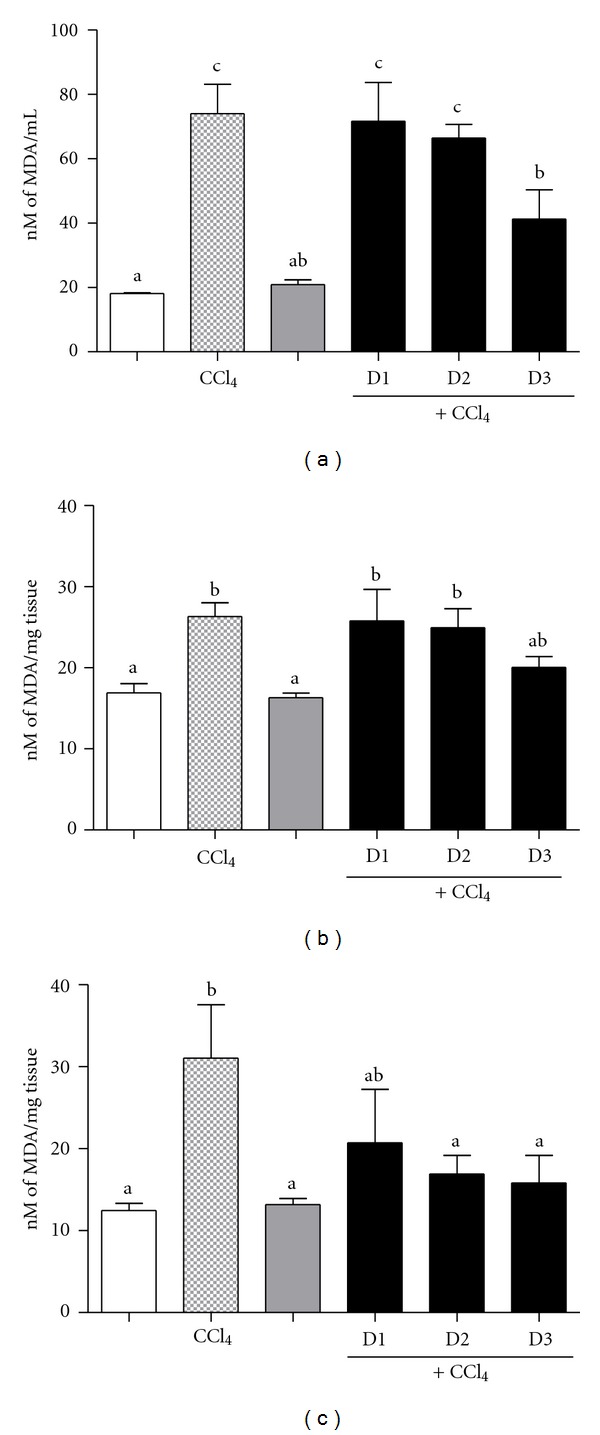
Figure 4.

Levels of thiobarbituric acid reacting substances (TBARS) in blood (a), liver (b), and kidneys (c) of mice in each group. TBARS was measured as nM of malondialdehyde formed. Each data bar represents mean of six replicates in each group ± SEM. Means having same alphabets on each bar do not differ (P ≤ 0.05) from each other. Negative control group: receive 1% DMSO (White column), toxin control group: receive 30% CCl4 (Light gray column), positive control group: receive α-tocopherol + CCl4 (Heavy gray column), and extract treated groups: received three different concentrations of R. tomentosa extract (0.2, 0.4, and 0.8 g/kg) + CCl4 (Black column).
