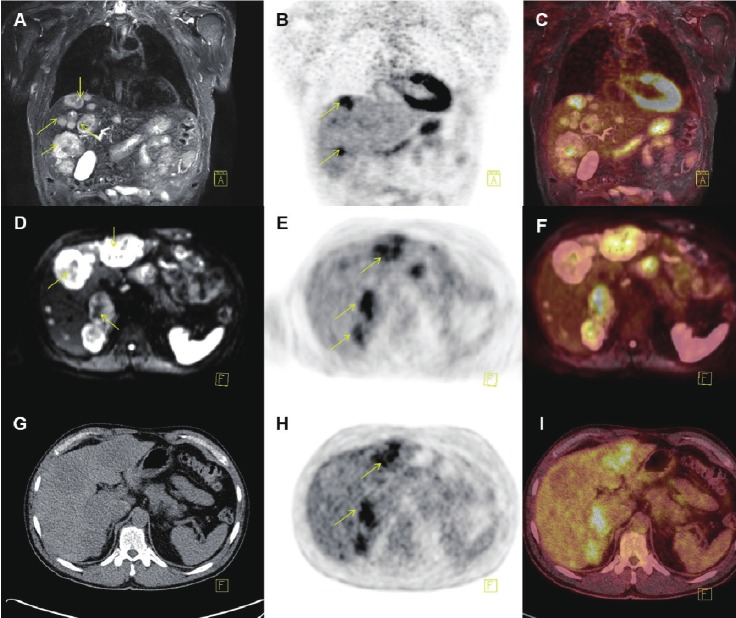
Figure 11.
PET/MR (A-F) and PET/CT (G-I) images of a patient with multiple liver metastases (yellow arrows) from a neuroendocrine tumor located in the rectum: A: Coronal T2 weighted STIR MR, B+E: FDG-PET and C: fused PET/MR illustrating several metastases to the liver, but only some of them PET positive. D-F: Transaxial DWI MRI and FDG-PET illustrating some but not complete overlap between metastases with high signal intensity on DWI MRI and FDG-PET. Finally G-I: illustrates transaxial CT and PET from the PET/CT scanner, with hardly any metastases being visible on the liver on CT-images (not contrast enhanced).

