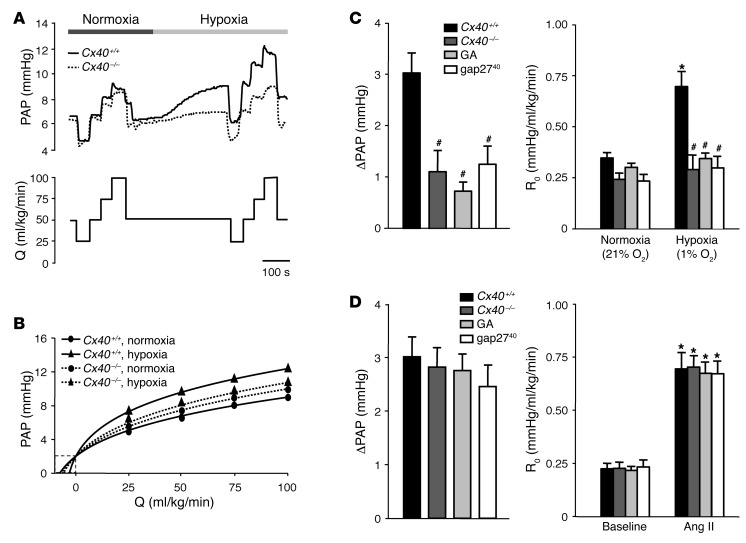
Figure 2. Cx40 is required for an intact HPV response.
(A) Representative tracings of PAP in isolated perfused lungs of Cx40+/+ and Cx40–/– mice obtained during stepwise changes in lung perfusion (Q) at normoxia (21% O2) or hypoxia (1% O2). Note the attenuated HPV response in Cx40–/– mice. (B) Nonlinear regression analysis according to the distensible vessel model yielded representative pressure-flow curves for lungs of Cx40+/+ and Cx40–/– mice at normoxia and hypoxia. The pressure at 0 ml/kg/min flow (Q) reflects left arterial pressure of 2 mmHg, while the slope of the pressure-flow curve at 0 ml/kg/min flow reflects R0. (C) Group data showing acute HPV response, determined as ΔPAP and as R0 10 minutes after hypoxia onset versus normoxia, in untreated isolated perfused lungs of Cx40+/+ and Cx40–/– mice and in lungs of Cx40+/+ mice treated with 18α-glycyrrhetinic acid (GA; 50 μM) or gap2740 (200 μM). (D) Group data (n = 5 lungs each) showing acute HPV response to Ang II (1 μg bolus infusion), determined as ΔPAP and as R0 versus baseline, in untreated isolated perfused lungs of Cx40+/+ and Cx40–/– mice and in lungs of Cx40+/+ mice treated with 18α-glycyrrhetinic acid or gap2740. *P < 0.05 vs. normoxia or baseline control; #P < 0.05 vs. untreated Cx40+/+.

