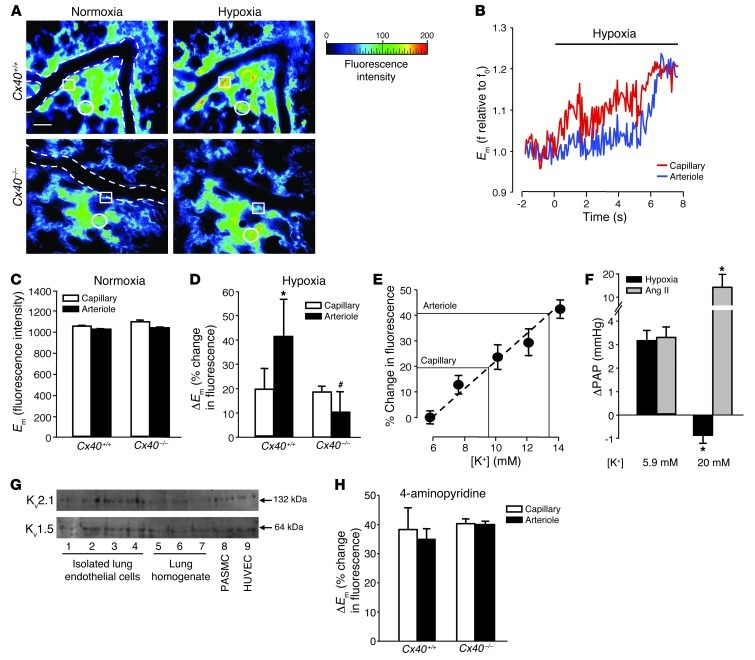
Figure 6. Endothelial membrane depolarization.
(A) Representative images (of 5 replicates) showing endothelial di-8-ANEPPS fluorescence in capillaries and arterioles of Cx40+/+ and Cx40–/– lungs at normoxia (21% O2) and after 10 minutes of hypoxia (1% O2). Arteriolar vessel margins are shown by dotted lines, and representative capillary and arteriolar endothelium are denoted by circles and squares, respectively. Scale bar: 50 μm. (B) Representative tracings (of 5 replicates) of di-8-ANEPPS fluorescence. Hypoxia-induced ΔEm in capillaries preceded arteriole response. Group data (n = 5 lungs each) showing (C) comparable baseline endothelial di-8-ANEPPS fluorescence (reflecting Em) and (D) hypoxia-induced increases in endothelial di-8-ANEPPS fluorescence (reflecting ΔEm) in capillaries and arterioles of Cx40+/+ and Cx40–/– lungs. *P < 0.05 vs. capillaries; #P < 0.05 vs. Cx40+/+. (E) Calibration of endothelial di-8-ANEPPS fluorescence by lung perfusion with different [K+]. n = 3 lungs each. (F) Group data (n = 5 lungs each) showing ΔPAP in response to hypoxia (1% O2) or Ang II (1 μg bolus) in isolated Cx40+/+ lungs perfused with 5.9 or 20 mM [K+]. *P < 0.05 vs. 5.9 mM. (G) Representative Western blots showing Kv1.5 and Kv2.1 expression in freshly isolated pulmonary endothelial cells; whole lung homogenate, rat PASMCs, and HUVECs served as controls. (H) Group data (n = 5 lungs each) showing endothelial ΔEm in capillaries and arterioles of Cx40+/+ and Cx40–/– lungs in response to 10 mM 4-aminopyridine. No significant differences.

