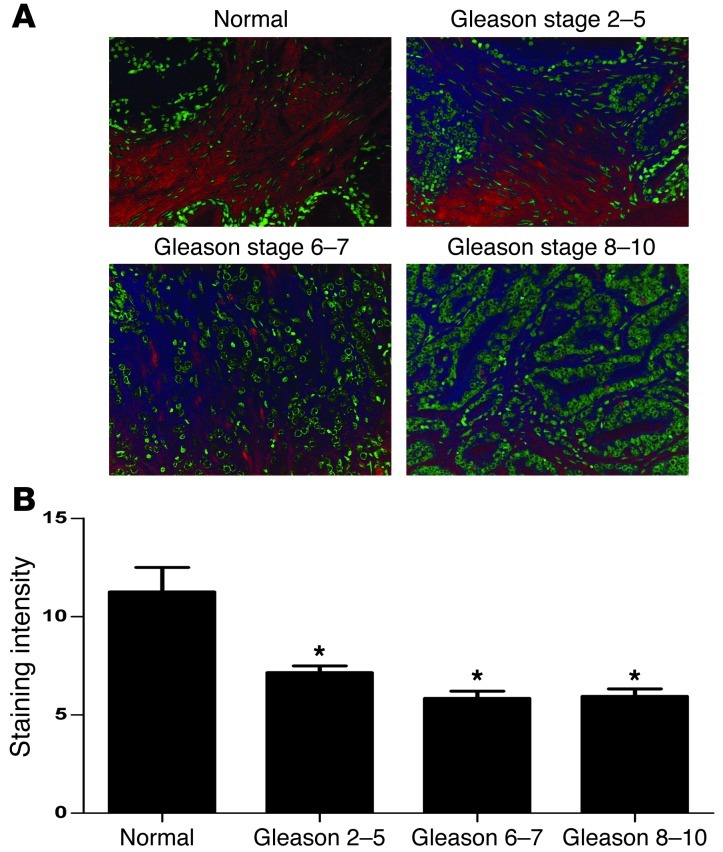
Figure 7. Expression of PN1 in human prostate cancer.
(A) Immunohistochemistry for PN1. PN1 is reduced in the stroma of Gleason scores 2–5, 6–7, and 8–10 prostate tumor compared with normal tissue. Red stain represents PN1, and green represents nuclei. Original magnification, ×20. (B) Quantitation of PN1 stain in normal prostatic tissue versus Gleason tumors. One-way ANOVA (n = 10).

