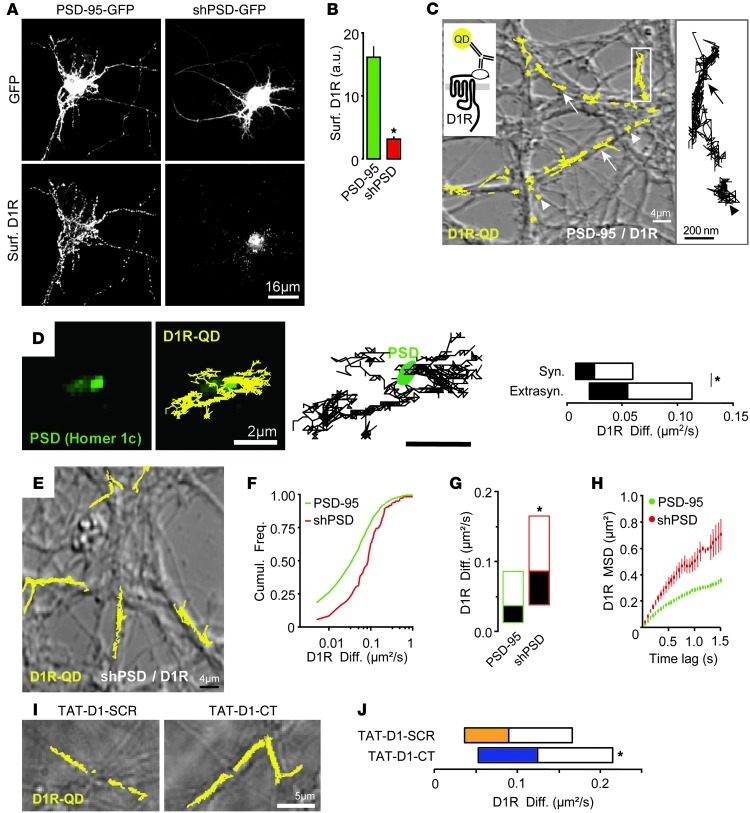
Figure 5. PSD-95 knockdown or peptide disrupting PSD-95–D1R interaction alters D1R surface content and dynamics on cultured striatal neurons.
(A and B) Immunostaining of surface D1R (A) showed a significant decrease in surface D1R in shPSD neurons (B). Scale bar: 16 μm. *P < 0.05. (C) Representative trajectories of surface D1Rs labeled with a single QD-antibody complex (inset) at the surface of a PSD-95–expressing neuron. A fraction rapidly diffused along dendrites and explored large areas (arrows), whereas others diffused in a confined area (arrowheads). Scale bars: 4 μm (left); 200 nm (right). (D) Representative trajectories of surface D1R on a Homer1c-GFP–expressing neuron. Also shown are distributions (median and 25%–75% IQR) of the instantaneous diffusion coefficient of surface D1Rs inside and outside the PSD area. Scale bar: 2 μm. *P < 0.05. (E) Representative trajectories of surface D1Rs on a shPSD-expressing striatal neuron. Scale bar: 4 μm. (F) Cumulative distribution of the instantaneous diffusion coefficient of surface D1Rs, starting from the percentage of immobile receptors. (G) Corresponding distributions of the instantaneous diffusion coefficient of surface D1Rs. *P < 0.05. (H) The relationship between mean square displacement (MSD) and time of surface D1R trajectories was not linear (dotted line denotes free diffusion), adopting negative curvature, characteristic of confined behavior (Kolmogorov-Smirnov test). (I and J) Representative trajectories (I) and distributions of the instantaneous diffusion coefficient (J) of surface D1Rs in the presence of TAT-D1-SCR or TAT-D1-CT. Scale bar: 5 μm. *P < 0.05.

