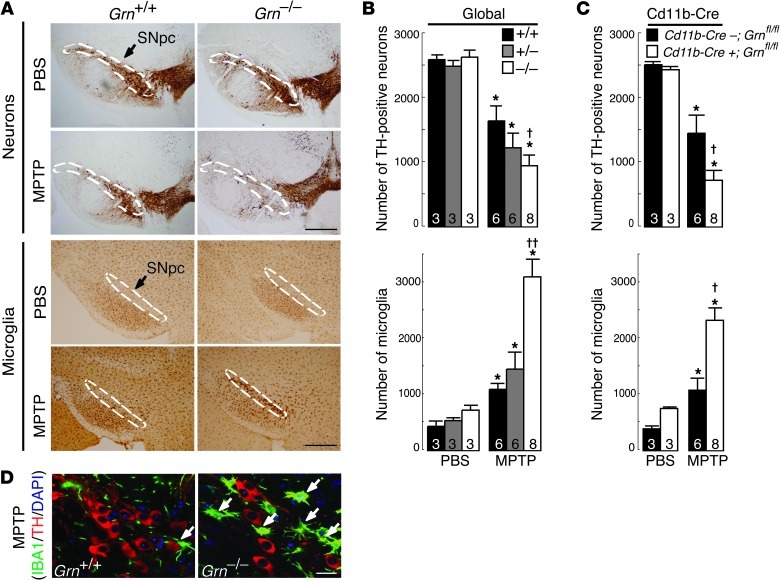
Figure 1. Increased neuron death and microglial activation caused by PGRN deficiency in a model of CNS injury.
(A) Representative SNpc sections showing decreased numbers of TH-positive neurons and increased numbers of IBA1-positive microglia following MPTP exposure in PGRN-deficient mice. Dashed lines indicate SNpc. Scale bars: 500 μm. (B) Quantification of TH-positive neurons and IBA1-positive microglia in the SNpc in the global PGRN-deficient mouse model. Numbers denote n per group. *P < 0.05, MPTP versus PBS; †P < 0.05, Grn+/+ MPTP versus Grn–/– MPTP; ††P < 0.01, Grn–/– MPTP versus either Grn+/+ or Grn+/– MPTP. (C) Quantification of TH-positive and IBA1-positive microglia in the SNpc in the microglia-targeted PGRN-deficient mouse model. Numbers denote n per group. *P < 0.05, MPTP versus PBS; †P < 0.05, Cd11b-Cre;Grnfl/fl MPTP versus Cd11b-Cre+;Grnfl/fl MPTP. (D) Representative confocal images showing that MPTP treatment decreased the number of TH-positive neurons (red) and increased the numbers of activated microglia (green) in the SNpc of Grn–/– mice. Arrows indicate activated microglia. Scale bar: 20 μm.

