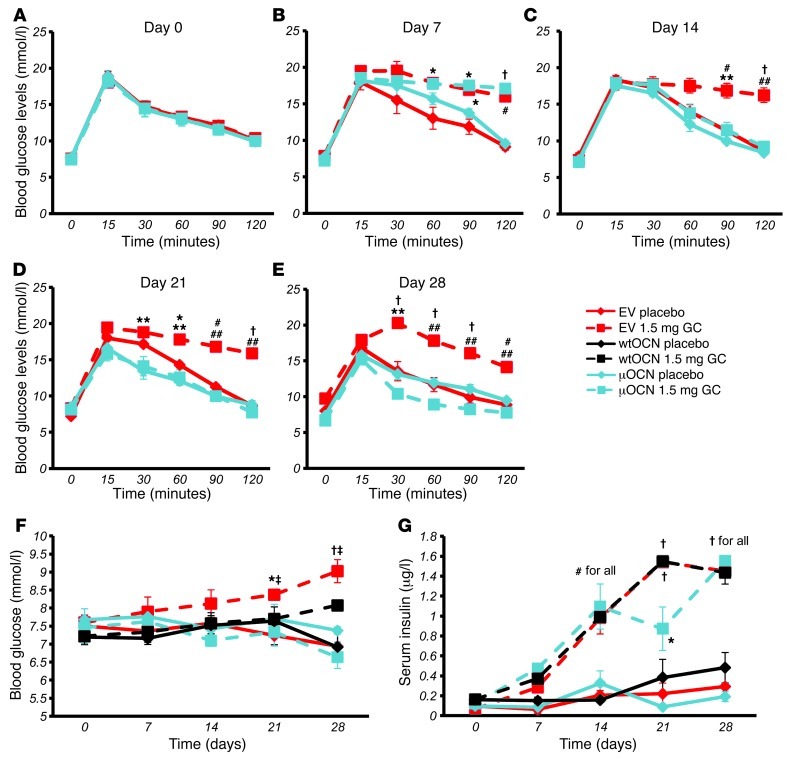
Figure 11. Heterotopic expression of μOCN from day 8 improves glucocorticoid-induced glucose tolerance.
(A–E) oGTTs in EV- (red) and μOCN (blue) vector–receiving mice (vector administered via hTVI on day 8) treated with either placebo (solid lines) or 1.5 mg corticosterone per week (dashed lines) on (A) day 0, (B) day 7, (C) day 14, (D) day 21, and (E) day 28. (F) Baseline fasting blood glucose concentration levels in EV- and wtOCN and μOCN vector–receiving mice treated with 1.5 mg corticosterone per week or placebo over the 4-week period. (G) Fasting serum insulin levels in EV- and wtOCN and μOCN vector–receiving mice treated with 1.5 mg corticosterone per week or placebo over the 4-week period (“for all” indicates that significance applies to all groups at this time point). *P < 0.05, #P < 0.01, †P < 0.001 compared with respective vector-receiving placebo-treated controls; ‡P < 0.05, **P < 0.01, ##P < 0.001 compared with other CS, corticosterone-treated groups receiving μOCN or wtOCN vectors (repeated-measures ANOVA followed by post-hoc analysis for time-dependent measurements; error bars represent SEM).

