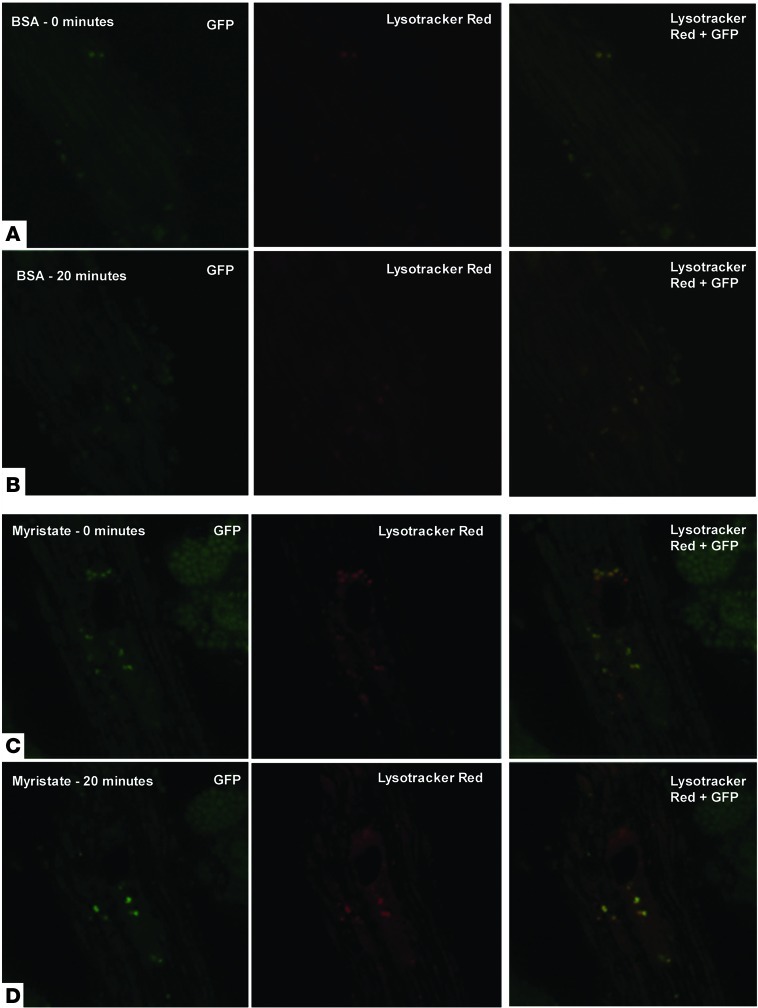
Figure 7. Myristate-treated cells do not display decreased autophagosome clearance.
After 16 hours of treatment with BSA (A and B) or myristate (C and D), GFP-LC3B–expressing cells were labeled with LysoTracker Red and observed by fluorescence microscopy for 20 minutes. Representative photomicrographs from the beginning and end of the time course (0 minutes and 20 minutes) are shown. Images were taken using a ×60 objective lens. In the panels presented, gamma settings of 0.7 for both red and green channels were used for all images. The heavily stained structure in the upper right quadrants of C and D is an adjacent cardiomyocyte undergoing cell death.

