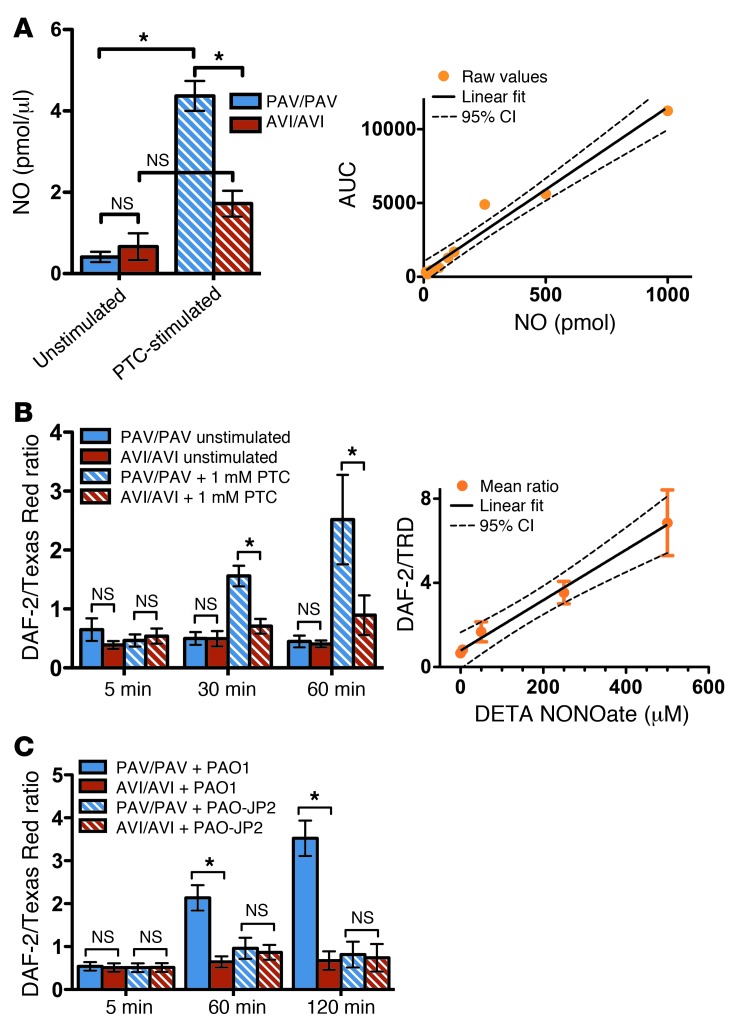
Figure 6. Human sinonasal ALI cultures exhibit T2R38-dependent apical NO diffusion.
(A) Left: NO metabolites were quantified from ASL (1 stimulated and 1 unstimulated culture used from 4 PAV/PAV and 3 AVI/AVI patients each). Right: Calibration using known NaNO3 standards. (B) Left: Fluorescence ratios of DAF-2 and Texas Red Dextran (TRD) were used to measure NO secretion. There was no change in ratios for unstimulated PAV/PAV or AVI/AVI cultures (solid bars; 0.65 ± 0.19 [PAV/PAV] and 0.39 ± 0.07 [AVI/AVI] at 5 minutes, 0.50 ± 0.11 [PAV/PAV] and 0.50 ± 0.10 [AVI/AVI] at 30 minutes, and 0.45 ± 0.10 [PAV/PAV] and 0.41 ± 0.06 [AVI/AVI] at 60 minutes). In contrast, PAV/PAV and AVI/AVI cultures had marked differences after PTC stimulation (0.46 ± 0.10 [PAV/PAV] and 0.54 ± 0.1 [AVI/AVI] at 5 minutes, 1.55 ± 0.17 [PAV/PAV] and 0.71 ± 0.1 [AVI/AVI] at 30 minutes, and 2.52 ± 0.76 [PAV/PAV] and 0.90 ± 0.3 [AVI/AVI] at 60 minutes). Right: Addition of 0, 5, 50, 250, and 500 μM DETA NONOate resulted in a linear increase in the DAF-2/TRD ratio. (C) Exposure to WT, but not AHL-deficient, Pseudomonas induced T2R38-dependent NO secretion. DAF-2/Texas Red ratios after exposure to PAO1 were 0.5 ± 0.1 (PAV/PAV) and 0.5 ± 0.1 (AVI/AVI) at 5 minutes, 2.1 ± 0.3 (PAV/PAV) and 0.6 ± 0.1 (AVI/AVI) at 60 minutes, and 3.5 ± 0.4 (PAV/PAV) and 0.7 ± 0.2 (AVI/AVI) at 120 minutes. Ratios after exposure to PAO-JP2 were 0.5 ± 0.1 (PAV/PAV) and 0.5 ± 0.1 (AVI/AVI) at 5 minutes, 1.0 ± 0.2 (PAV/PAV) and 0.9 ± 0.1 (AVI/AVI) at 60 minutes, and 0.8 ± 0.3 (PAV/PAV) and 0.7 ± 0.3 (AVI/AVI) at 120 minutes. *P < 0.05, ANOVA with Tukey-Kramer analysis.

