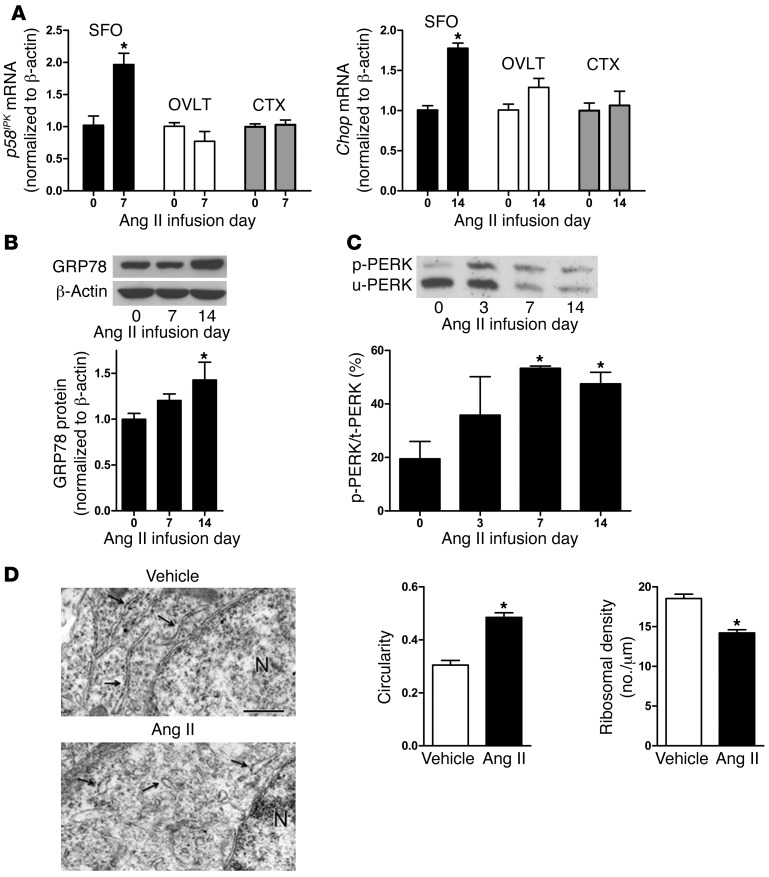
Figure 2. Increased circulating Ang II induces ER stress in the SFO.
(A) Real-time PCR measurements of ER stress biomarkers p58IPK and Chop from micropunches of the SFO, OVLT, and CTX at key time points during systemic Ang II infusions (n = 3–4). (B) Representative Western blot and quantitative summary of the ER chaperone GRP78 in SFO homogenates at select time points during Ang II–induced HTN (n = 3–5). (C) Representative Phos-tag gel (upper panel) showing phosphorylated (p-PERK) and un-phosphorylated (u-PERK) PERK in SFO homogenates harvested at key time points during Ang II infusions. Data are summarized (lower panel) and expressed as a percentage of p-PERK relative to total PERK (n = 3). (D) Representative electron micrographs (left panels) of RER (arrows) in SFO neurons at day 14 of vehicle or Ang II infusions (N, nucleus). Quantification (right panels) of RER profile circularity (4π × area/ perimeter2) and ribosome density (n = 105–121 RER profiles/group, n = 3 mice/group). Scale bar: 500 nm. *P < 0.05 versus day 0 or vehicle.

