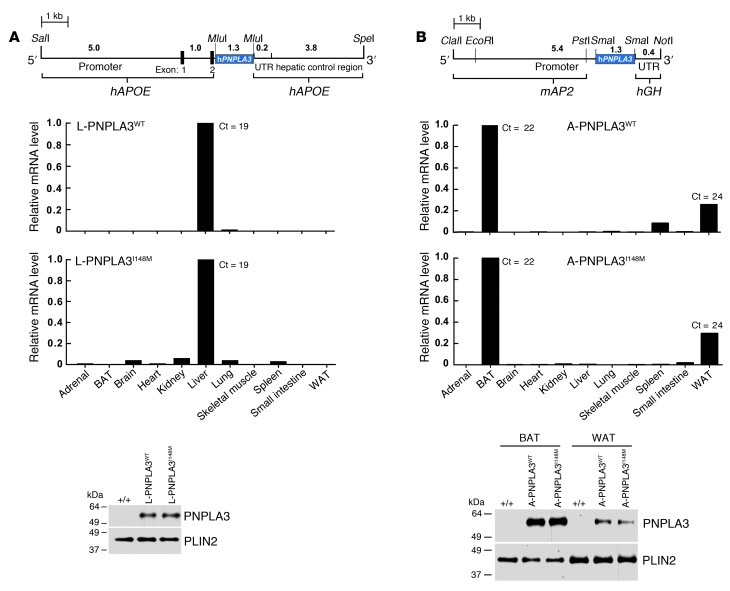
Figure 1. Tissue distribution of PNPLA3 mRNA in transgenic mice expressing human PNPLA3 predominantly (A) in the liver or (B) in adipose tissue.
(A) Schematic diagram of the PNPLA3 transgene, which is under control of a liver-specific enhancer/promoter element (30). Total mRNA was isolated from tissues of C57BL/6J mice expressing wild-type (L-PNPLA3WT) or mutant (L-PNPLA3I148M) human PNPLA3 (n = 4/group). Tissue levels of PNPLA3 mRNA were determined using real-time PCR, as described in the Methods. The cycle threshold (Ct) value in the liver is provided. Each value in the nonhepatic tissues represents the mRNA level relative to the value in liver. Immunoblot analysis was performed on lipid droplets isolated from the livers (22). A total of 1% of the volume of each fraction was size fractionated on an 8% SDS-PAGE gel and probed using a polyclonal anti-human PNPLA3 antibody (22). PLIN2, a lipid droplet protein, was used as a loading control. (B) Schematic diagram of the constructs used to make the A-PNPLA3WT and A-PNPLA3I148M mice (31). Tissue levels of PNPLA3 mRNA were measured by real-time PCR and expressed relative to the level in BAT. Immunoblot analysis of PNPLA3 in lipid droplets isolated from BAT and WAT was performed as described in A. UTR, untranslated region; hAPOE, human APOE; mAP2, mouse AP2; hGH, human GH.

