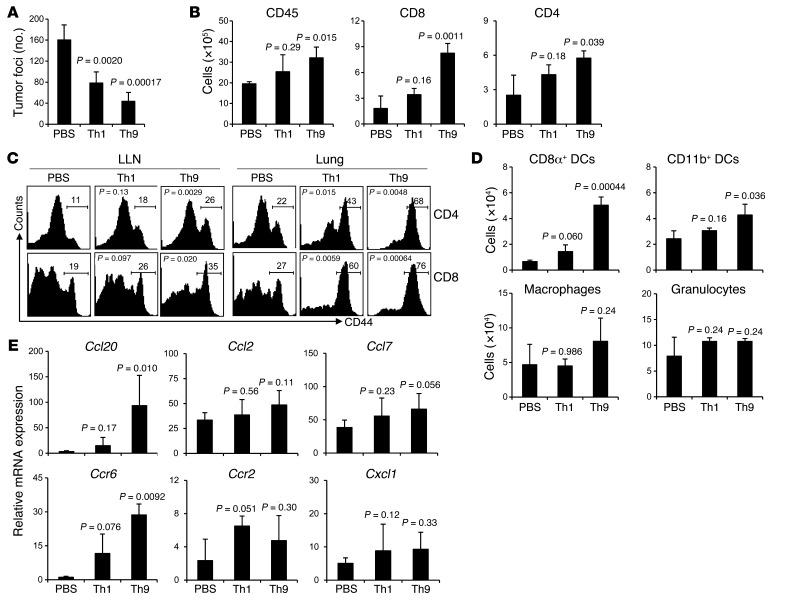
Figure 3. Therapeutic effect of tumor-specific Th9 cells.
PBS or 3 × 10⁶ Th1 or Th9 cells were transferred i.v. to C57BL/6 mice bearing 5-day established pulmonary B16-OVA melanoma. Mice (n = 4–5/group) were analyzed on day 19 after challenge. (A) Comparison of tumor foci numbers in the lung between treated mice. P = 0.042, Th1 versus Th9. (B) Number of total leukocytes, CD8+ T cells, and CD4+ T cells in the lung leukocyte fraction analyzed by FACS. P = 0.0014, Th1 versus Th9 for CD8+ T cells. (C) Expression of CD44 on CD4+ and CD8+ T cells from the LLN and lung leukocyte fraction. For Th1 versus Th9, P = 0.011 (LLN CD4+ T cells), P = 0.022 (LLN CD8+ T cells), P = 0.020 (lung CD4+ T cells), and P = 0.0035 (lung CD8+ T cells). (D) Cell numbers of myeloid population subsets in the lung leukocyte fraction analyzed by FACS. P = 0.00031, Th1 versus Th9 for CD8α+ DCs. (E) RT-PCR analysis of mRNA expression of chemokines and their receptors in the lung tumor tissues. Data shown were normalized to β-actin gene. For Th1 versus Th9, P = 0.014 (Ccl20), P = 0.025 (Ccr6). Representative results from 1 of 3 repeated experiments are shown. P values in the graphs show comparisons with PBS.

