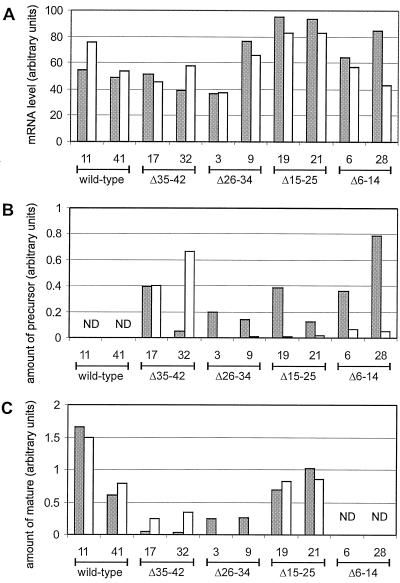
Figure 5.
Quantitative analysis of the expression of S. pratensis Fd. A, Quantitative analysis of a northern blot of total RNA from 1-week-old (gray bars) or 3-week-old (white bars) seedlings. B and C, Quantitative analysis of an immunoblot of total plant extracts of 1-week-old (gray bars) or 3-week-old (white bars) seedlings of precursor- and mature-sized proteins, respectively. The values are the averages of three experiments. ND, Not detectable.

