
Figure 6.
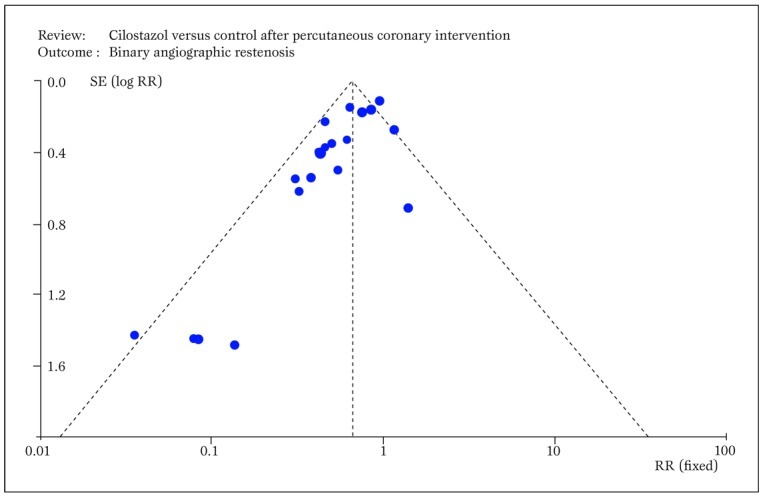
Typical funnel plot generated by RevMan showing small study bias, ie the asymmetric distribution of effect sizes in function of study precision, with selective publication of only positive small sample studies (RR=relative risk; SE=standard error). Modified from Biondi-Zoccai et al. (24).