
Figure 1.
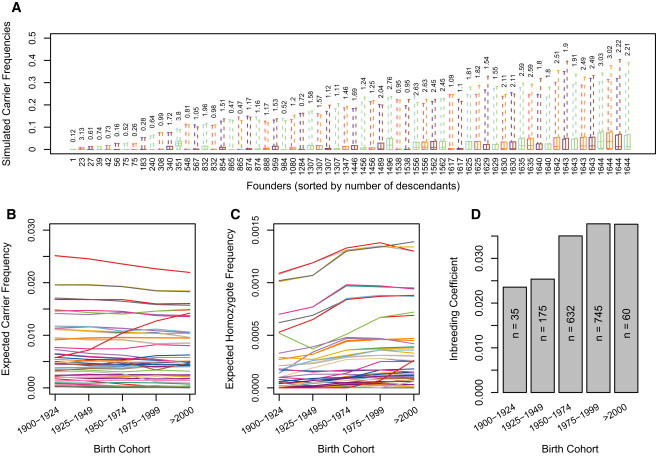
Results of Gene-Dropping Simulations
(A–C) Simulated carrier frequency in the current population for each unique founder mutation. Box plots show the distribution (first quartile, median, and third quartile; dashed lines show minimum and maximum) of frequencies that each founder mutation reached in 100,000 trials under two models. The box plots are ordered in pairs from left to right by the number of descendants (shown along x axis beneath box plots) in the study sample from each founder. The first box plot in each pair shows the simulated frequencies under a neutral model, and the second box plot shows the simulated frequencies under a zero fitness (lethal) model. In the current population, the expected percentage of variants that are attributable to a given founder is shown above the box plots. In (B) and (C), each line represents the simulated frequency of (B) heterozygous carriers and (C) homozygotes for a neutral founder mutation in 25 year birth cohorts. For many founder mutations, the frequency of homozygotes increases over time, whereas there is no such pattern observed for the frequency of carriers.
(D) Inbreeding coefficient by birth cohorts. The increase in consanguinity corresponds to the increase in the frequency of homozygotes in (C).