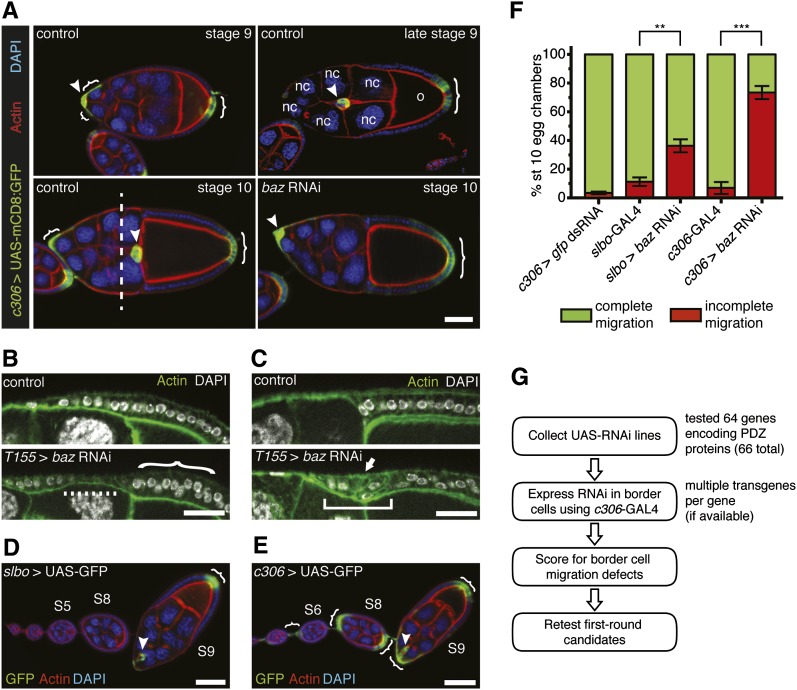
Figure 1 .
In vivo RNAi knockdown to identify PDZ domain-encoding genes required for border cell migration. (A) Control border cells (arrowheads) migrate between the nurse cells (nc) from stage 9 to 10 of oogenesis to reach the oocyte (o). Border cell clusters that have migrated past the dashed line (stage 10 control) are considered to have completed their migration. Border cells and follicle cells (brackets) express UAS-mCD8:GFP (green) driven by c306-GAL4 in egg chambers at the indicated stages; genotype is c306-GAL4/+; UAS-mCD8:GFP/+. Egg chambers were co-stained for actin (red) and DAPI (blue) to label cell membranes and nuclei, respectively. (Lower right panel) A stage 10 c306-GAL4/+; UAS-mCD8:GFP/UAS-baz RNAi v2914 (baz RNAi) egg chamber in which border cells did not migrate. Scale bar is 20 μm. (B and C) Knockdown of baz in follicle cells (bottom panels) using the follicle cell driver T155-GAL4 disrupts the epithelium compared with control (top panels) at stage 9 (B) and stage 10 (C). Genotypes are T155-GAL4/+ (control) and UAS-baz RNAi/+; +/T155-GAL4. Scale bar is 20 μm. (B) baz RNAi follicle cell layer is thin (dashed line), and some nuclei are misaligned (bracket) compared with control. (C) baz RNAi follicle cells are multilayered (arrow) and fail to retract over the oocyte (square bracket) as in control. (D and E) Ovarioles showing GAL4 expression patterns in border cells (arrowheads) and follicle cells (brackets) as visualized by UAS-mCD8:GFP (green); stages are indicated. Egg chambers were co-stained for actin (red) and DAPI (blue). Scale bar is 50 μm. (D) slbo-GAL4 expression pattern (slbo-GAL4, UAS-mCD8:GFP/+). (E) c306-GAL4 expression pattern (c306-GAL4/+; UAS-mCD8:GFP/+). c306-GAL4 is also expressed in stalk cells, which connect egg chambers within the ovariole. (F) Quantification of migration in stage 10 egg chambers of the indicated genotypes, shown as the percentage with complete (green) or incomplete (red) border cell migration. Error bars represent SEM; n ≥ 50 egg chambers in each of three trials (**P < 0.01; ***P < 0.001; two-tailed unpaired t-test). (G) Outline of the scheme used to survey the role of PDZ genes in border cell migration. Anterior is to the left in this and all subsequent figures.

